Role: Design Lead & Systems Architect
The Challenge: Walmart’s “Living Design” system lacked a standardized way to represent complex data, leading to inconsistent and inaccessible charts across internal tools.
-
UX Process:
-
Systemic Design: Audited 20+ internal dashboards to identify recurring data patterns.
-
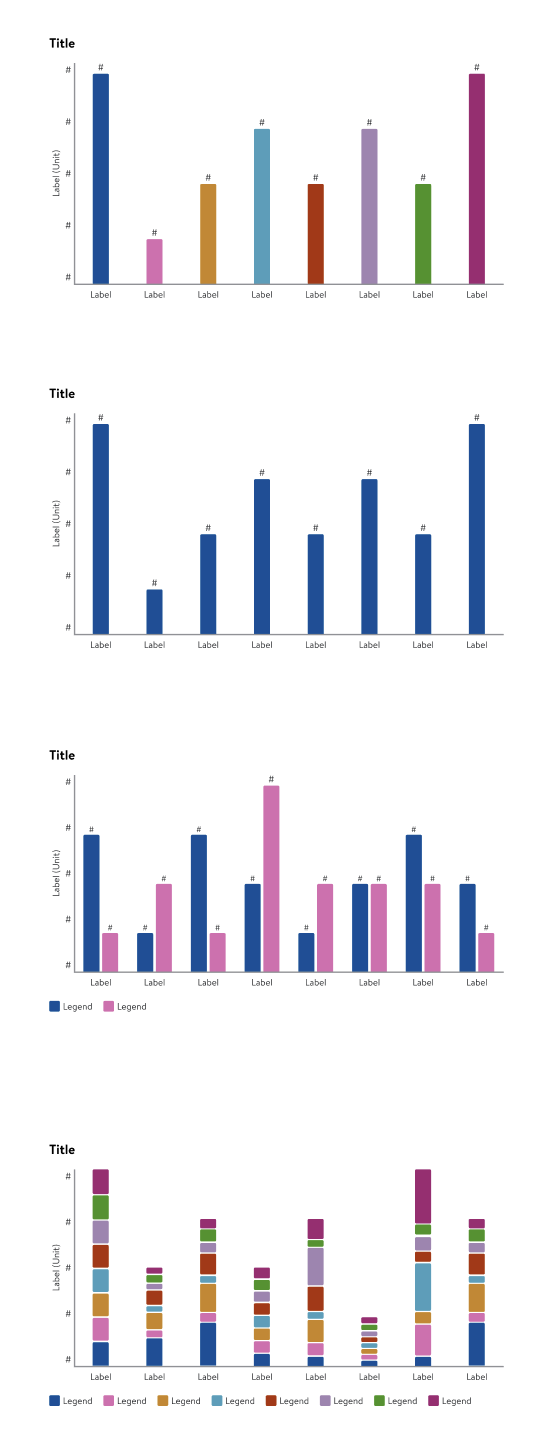
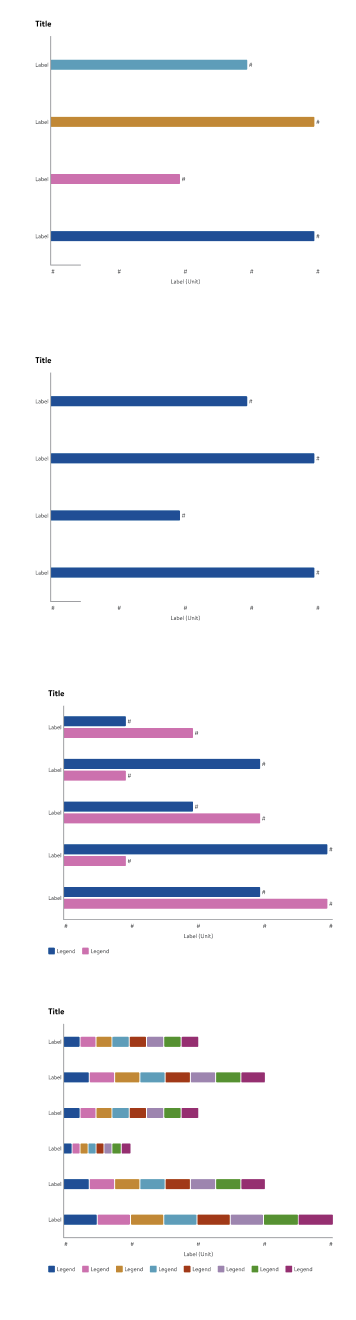
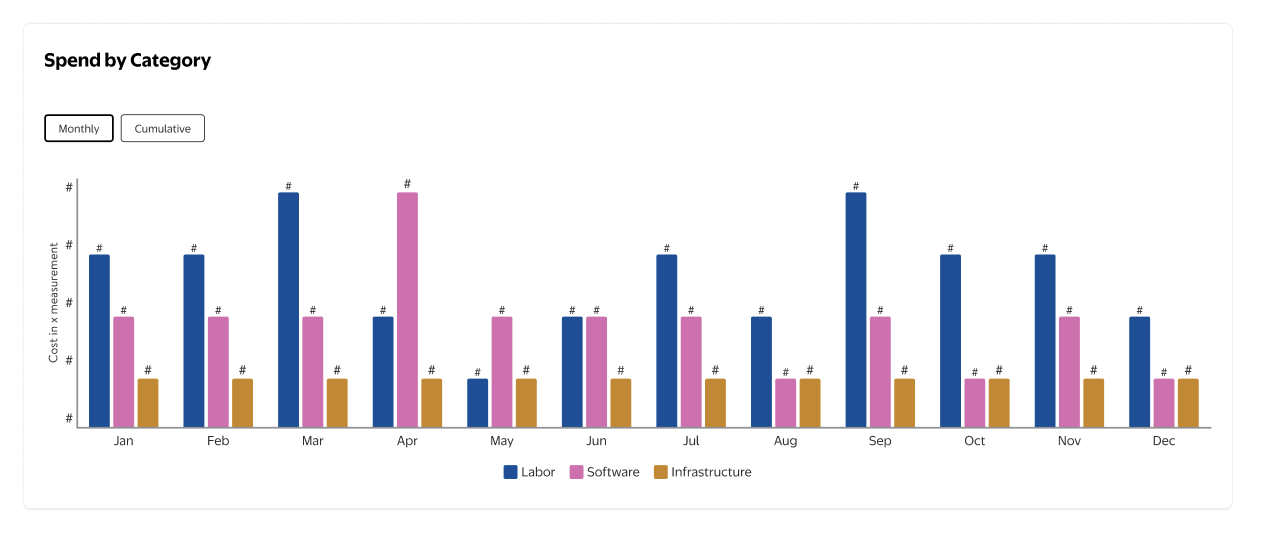
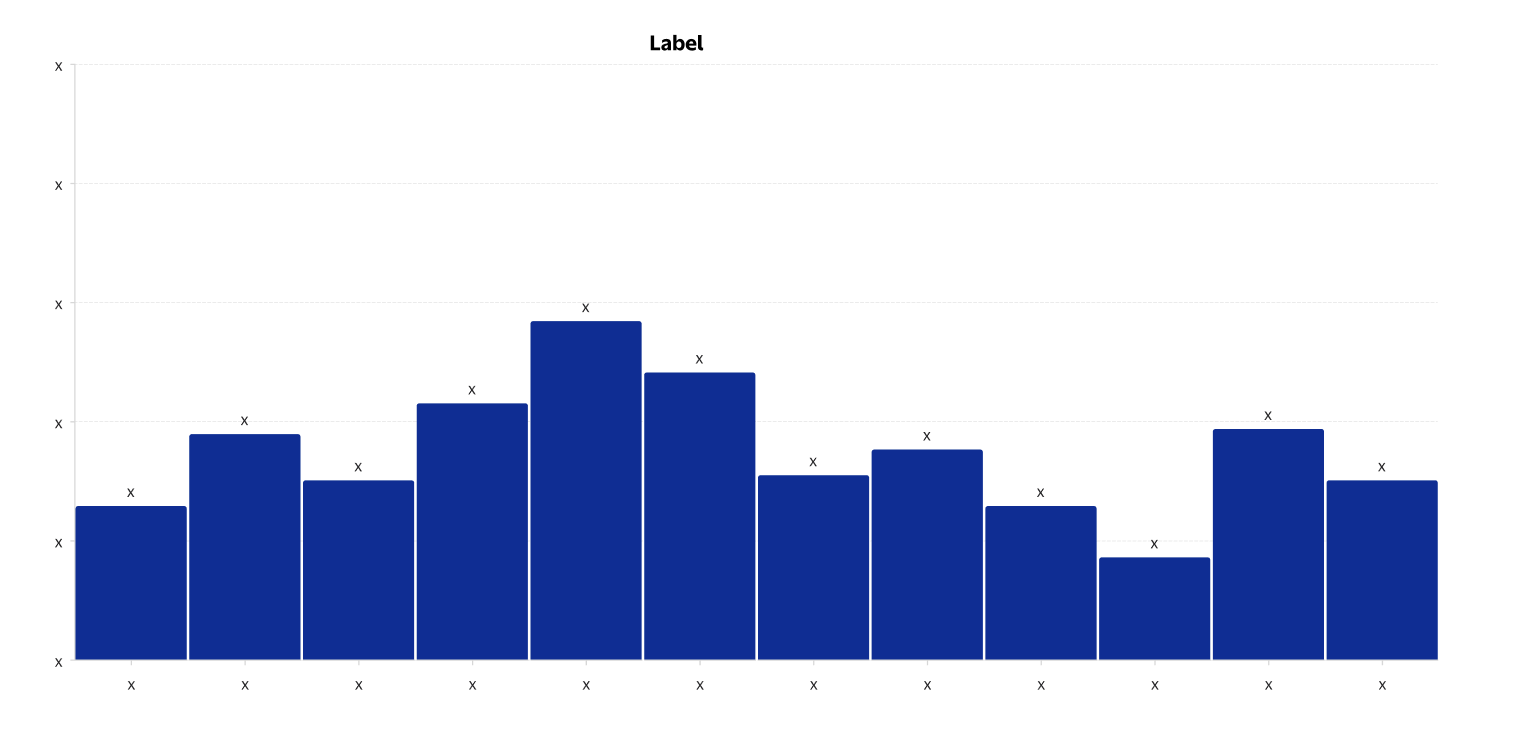
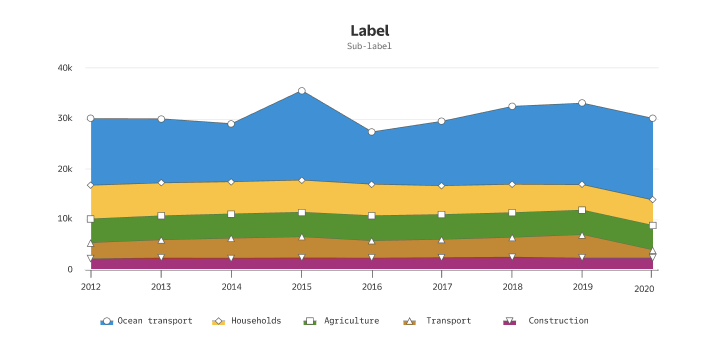
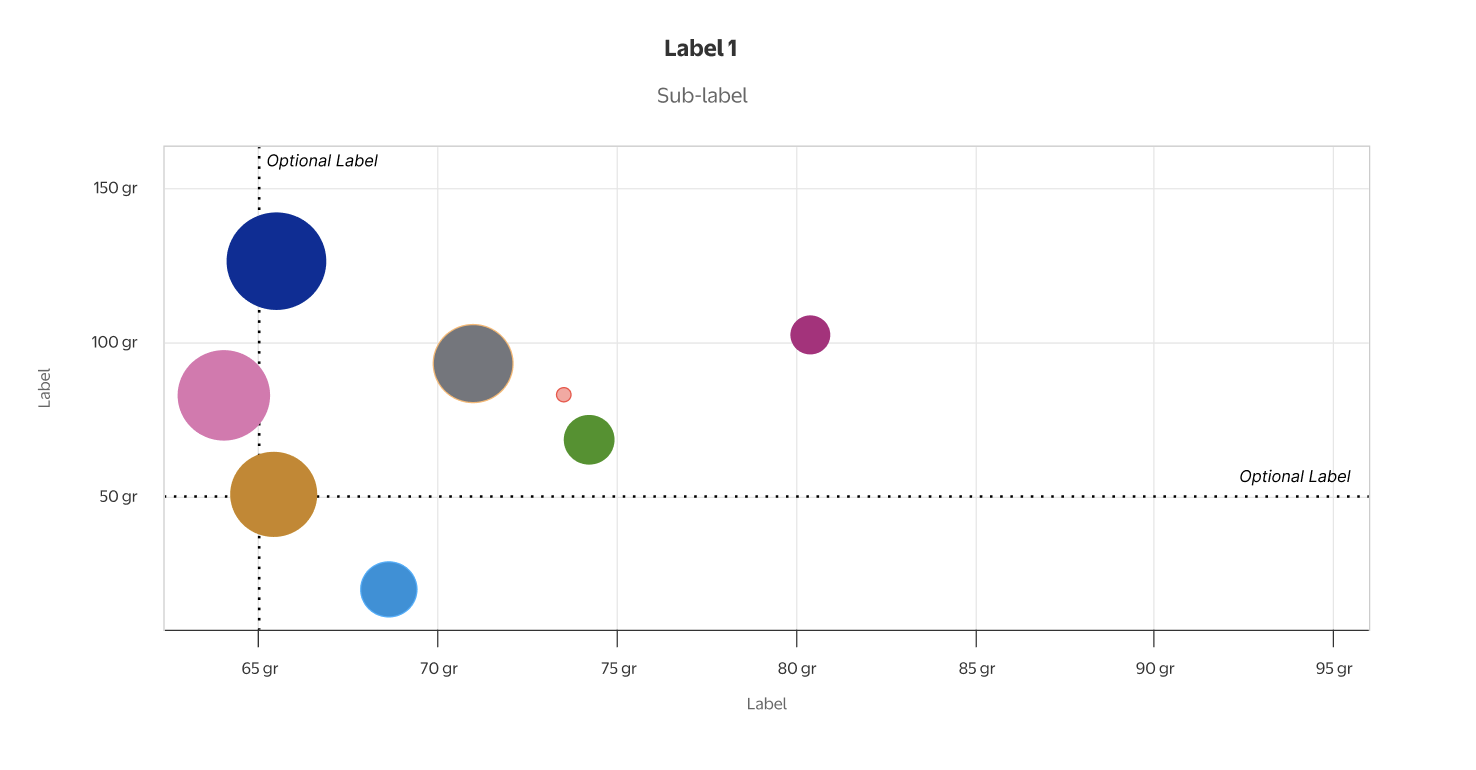
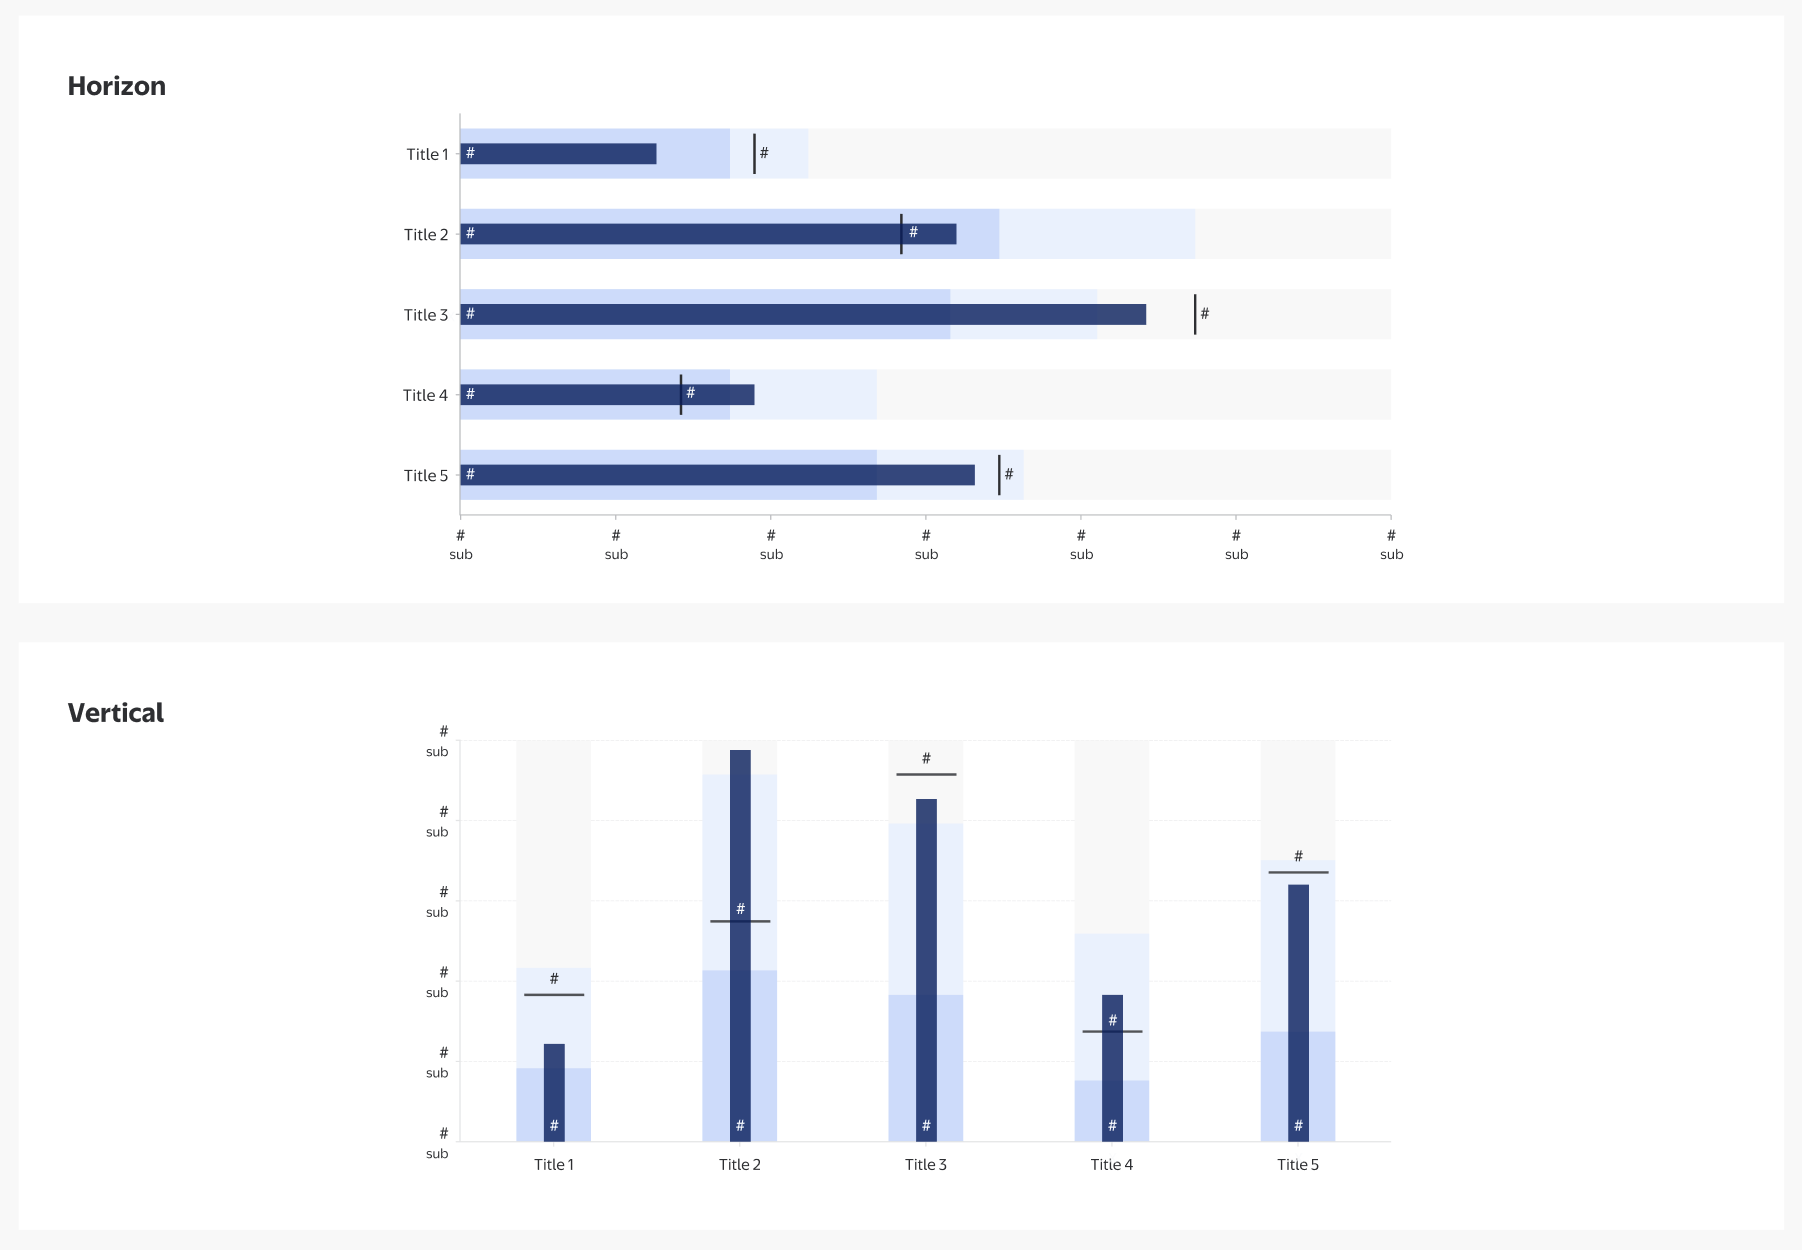
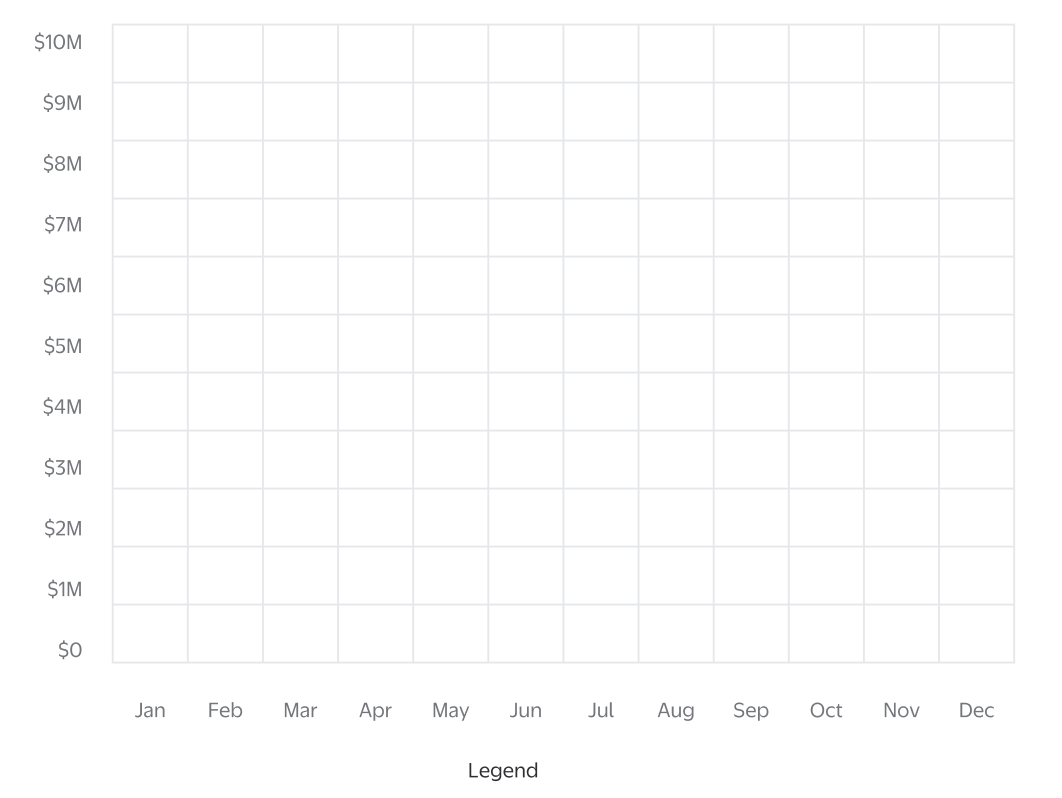
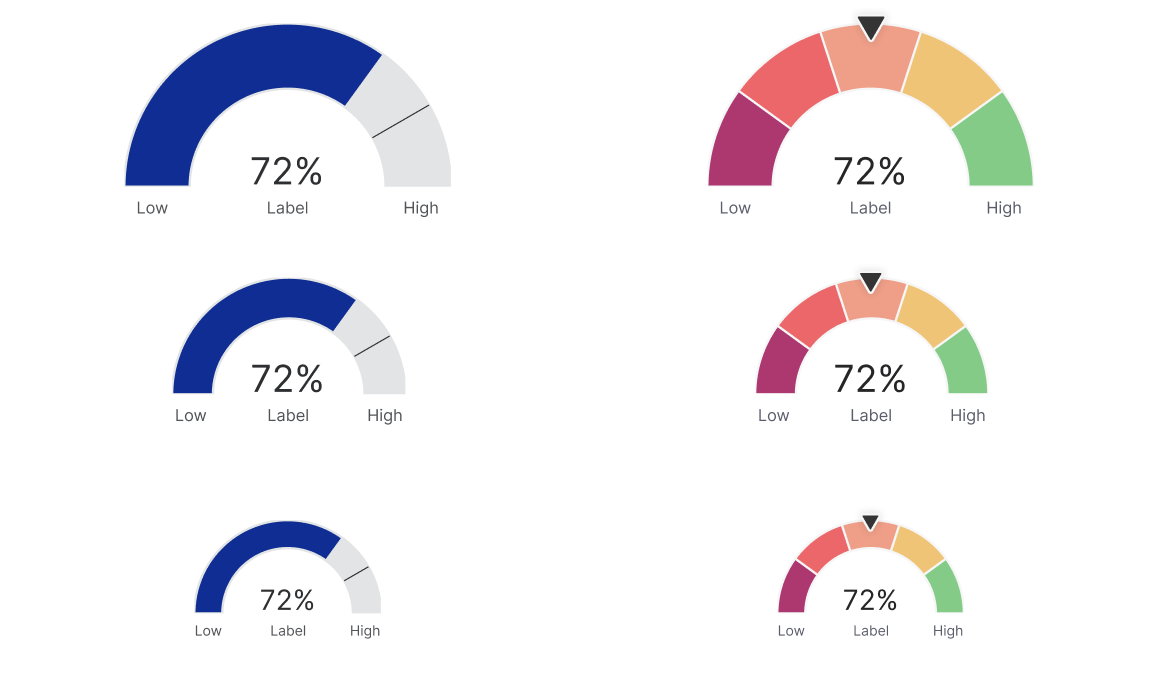
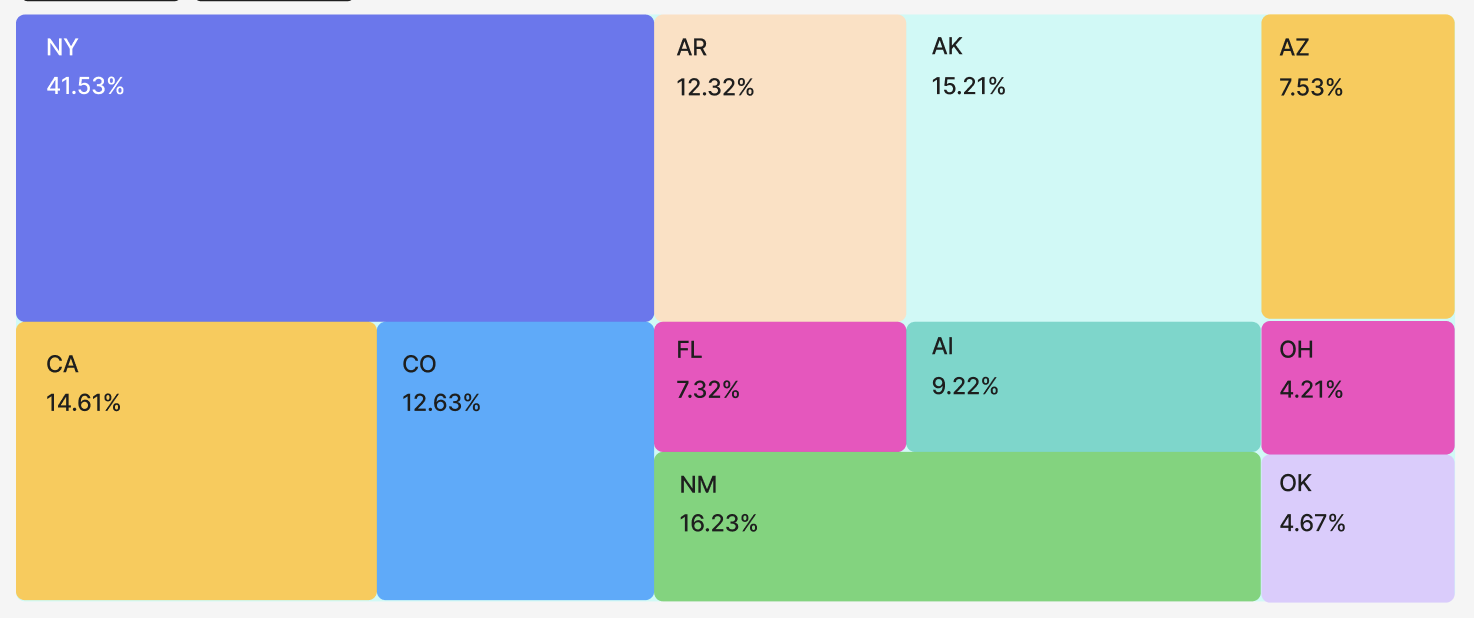
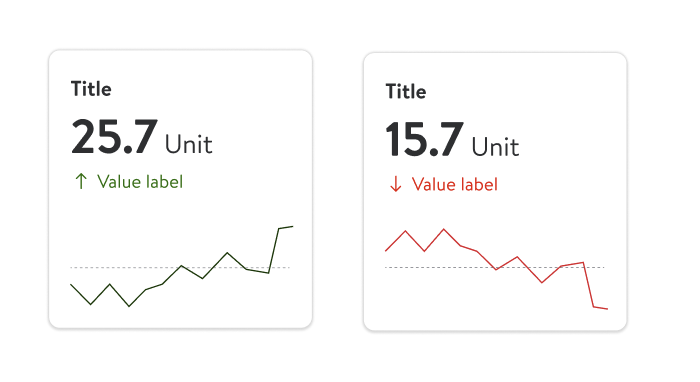
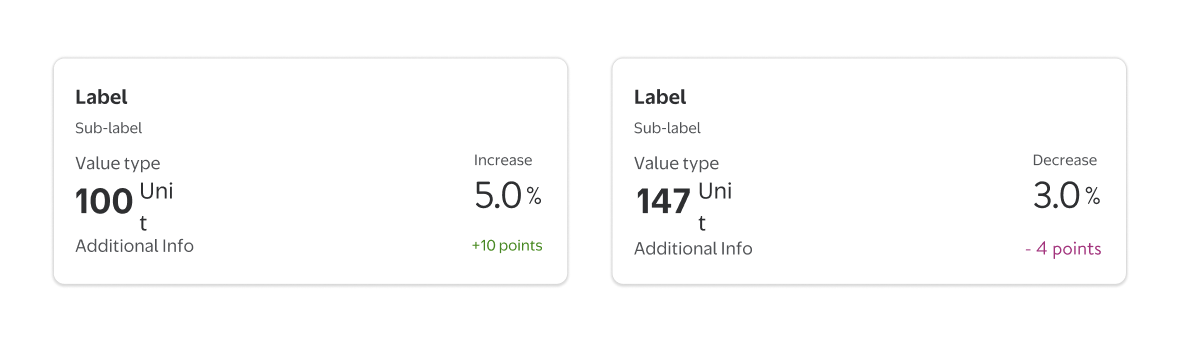
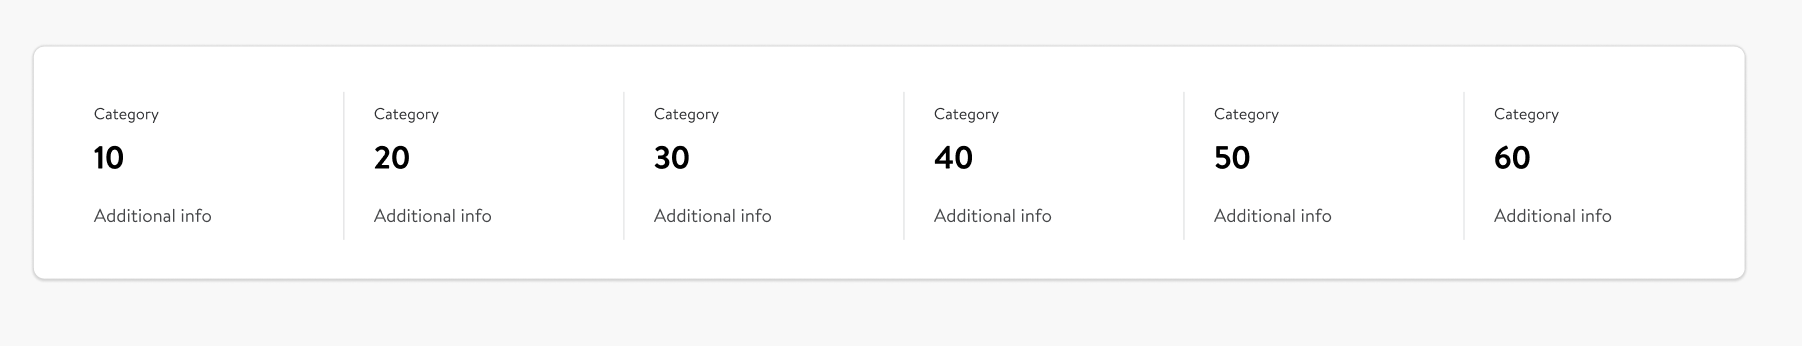
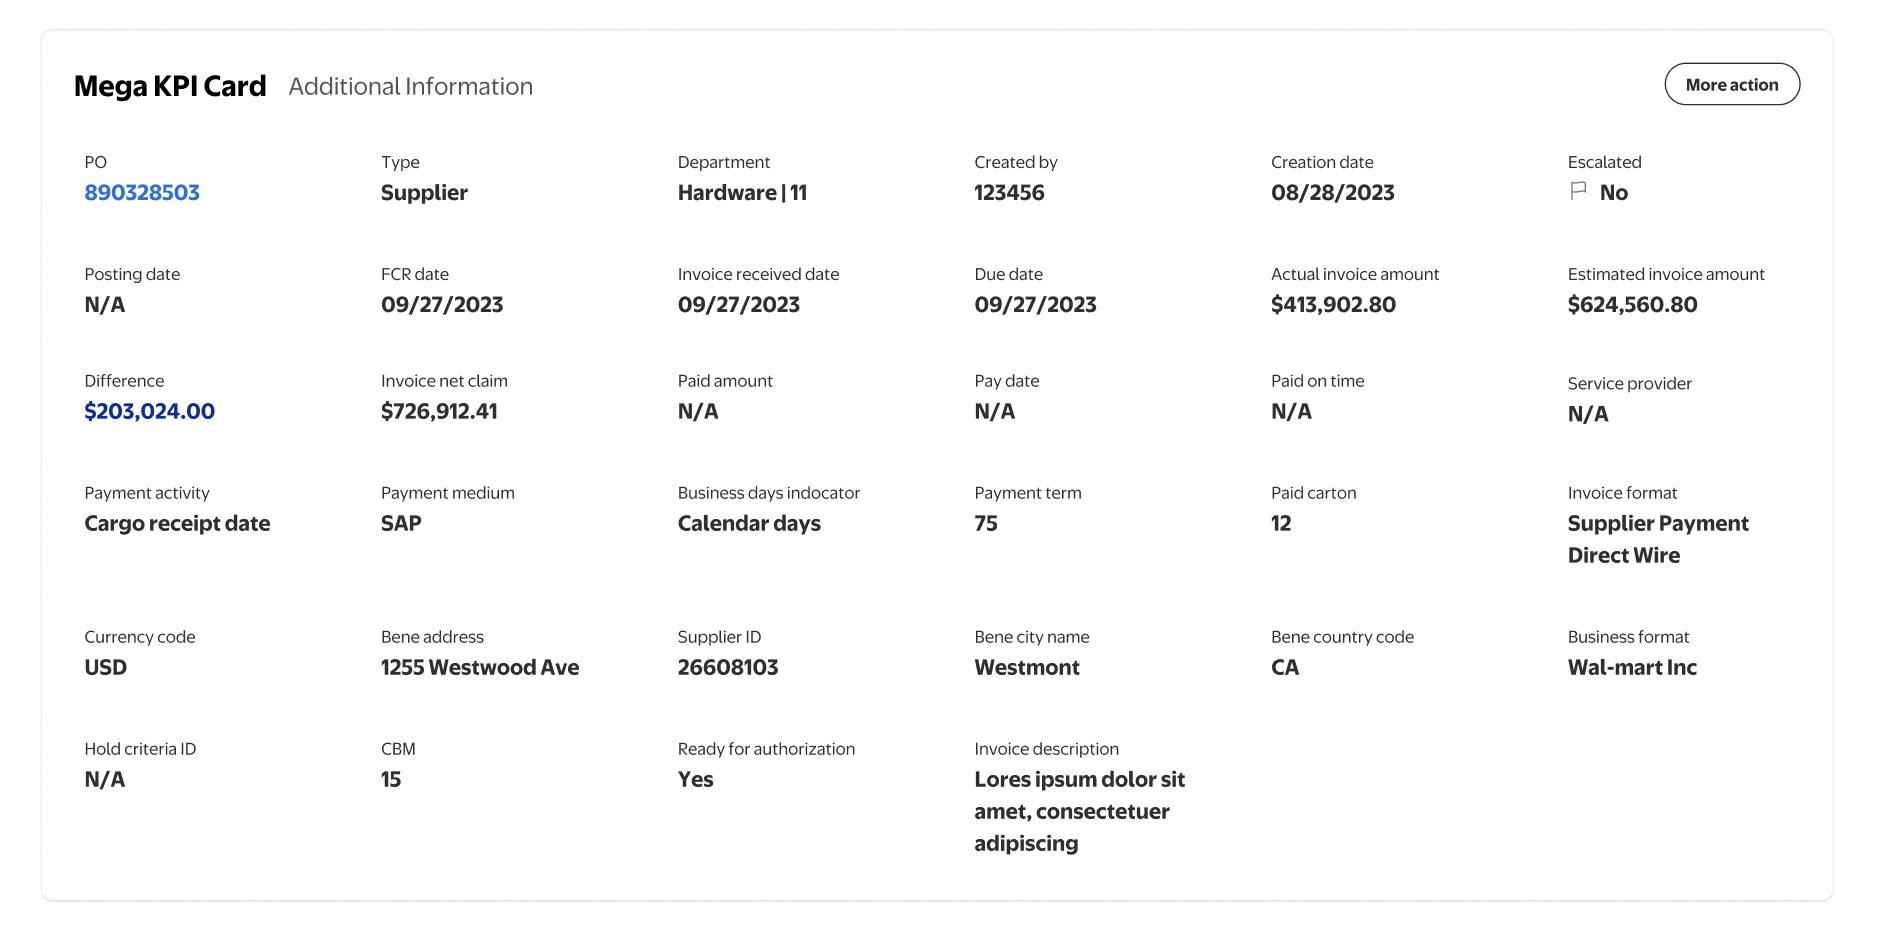
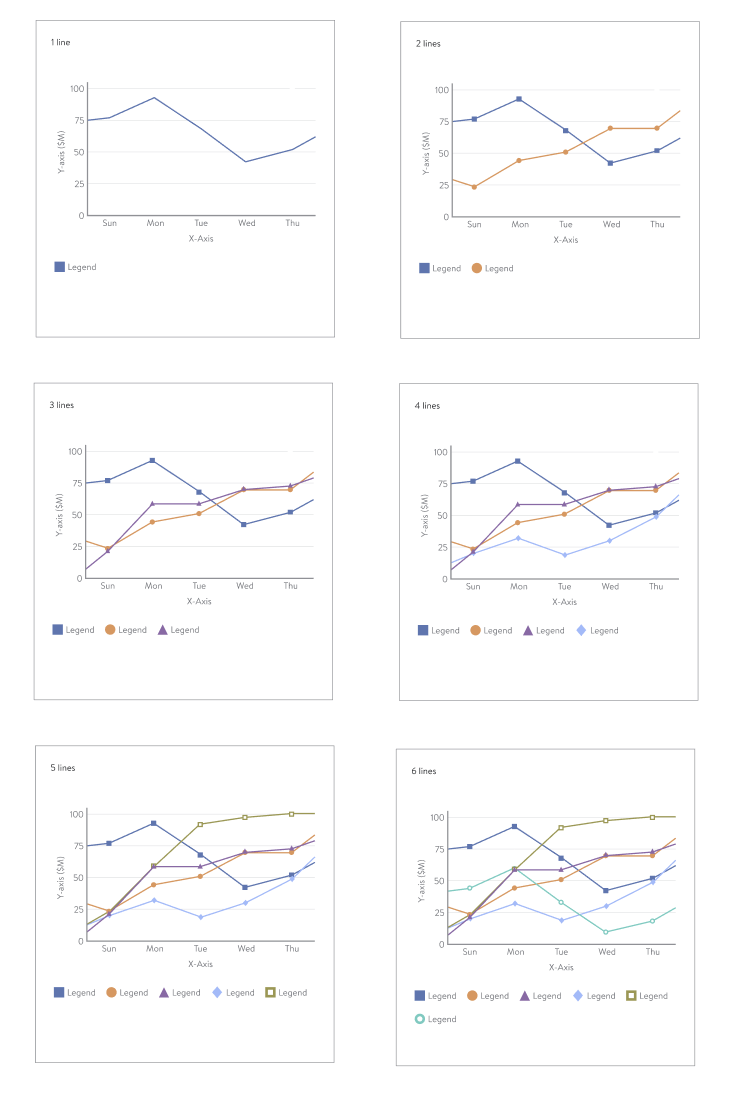
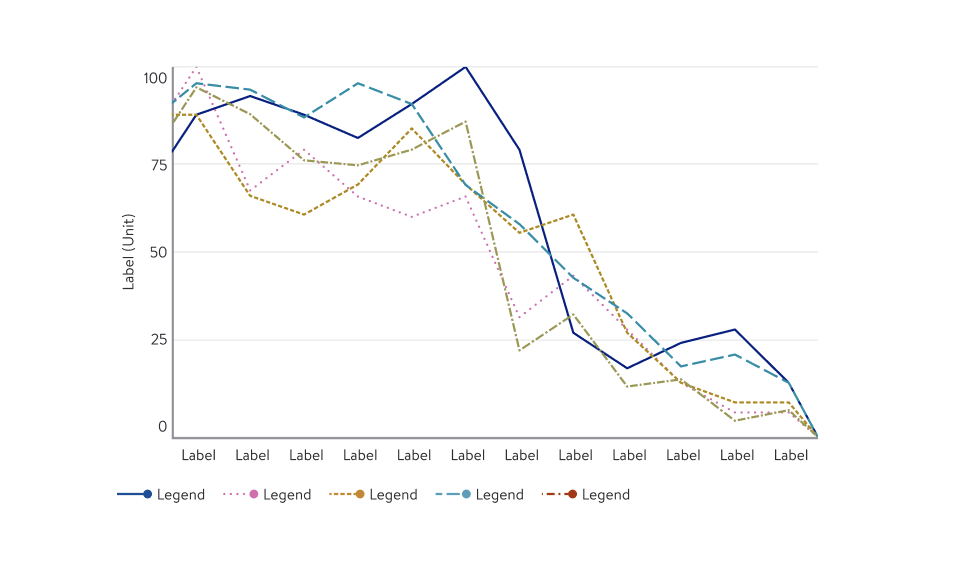
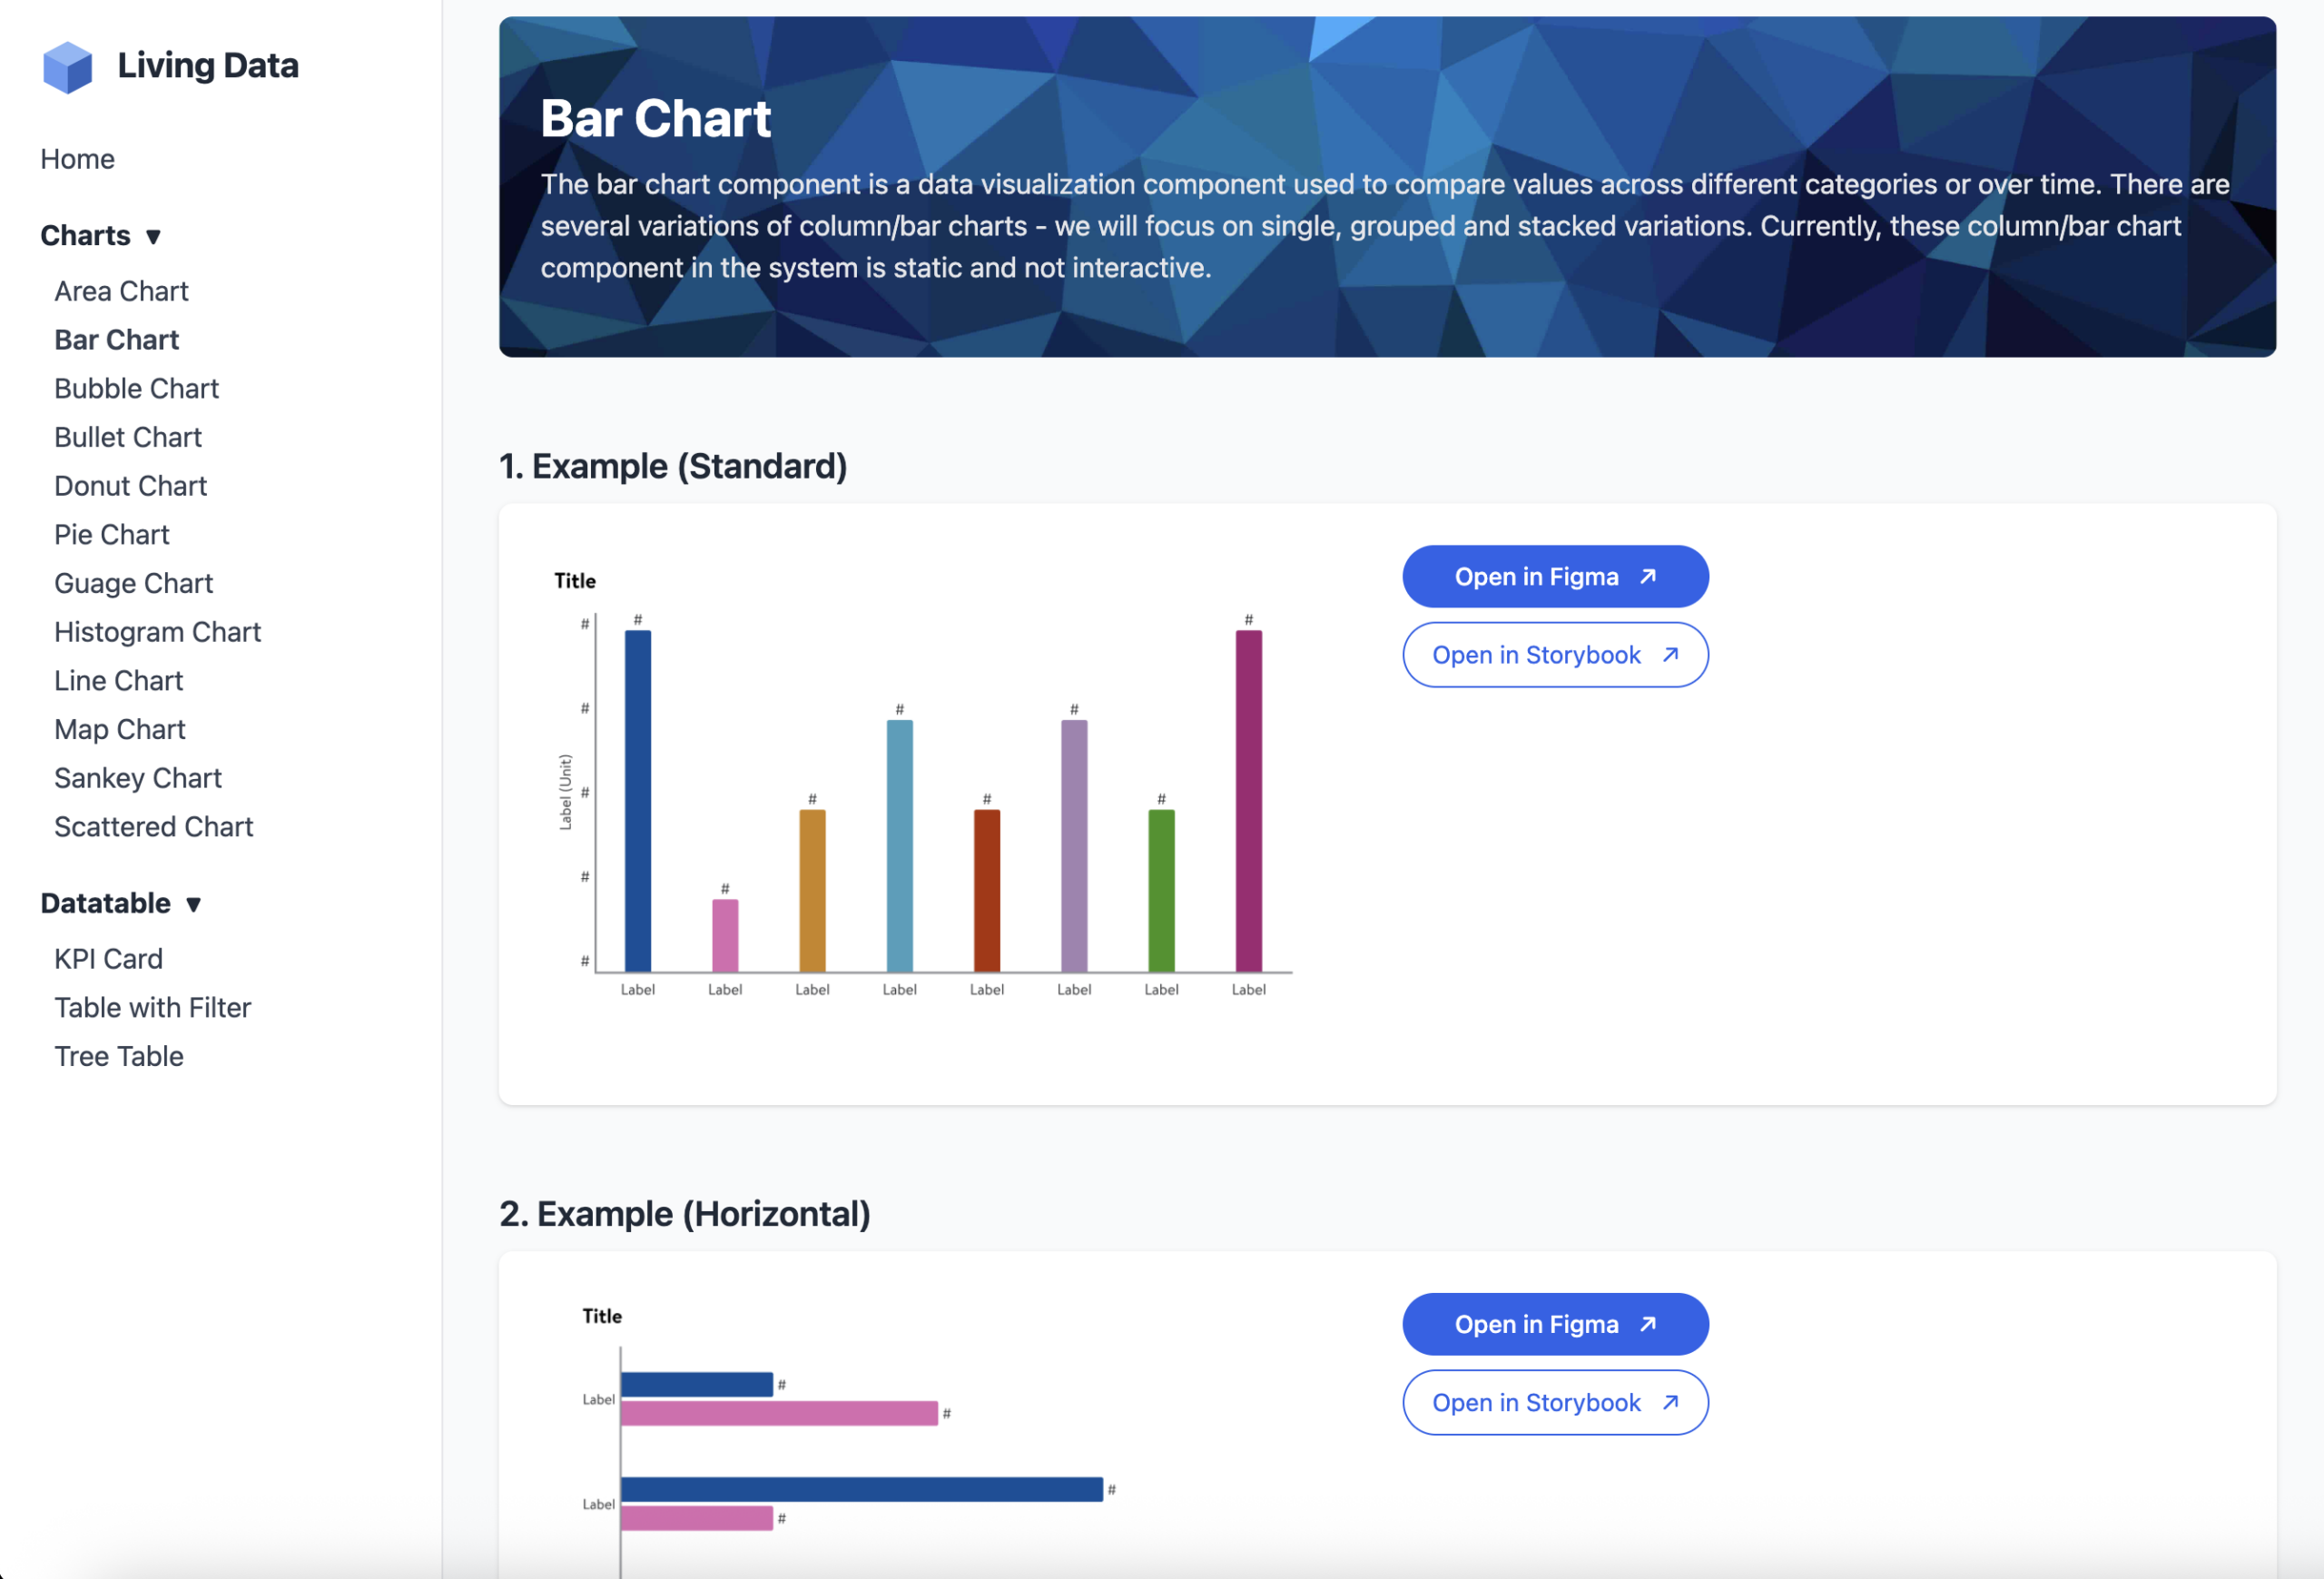
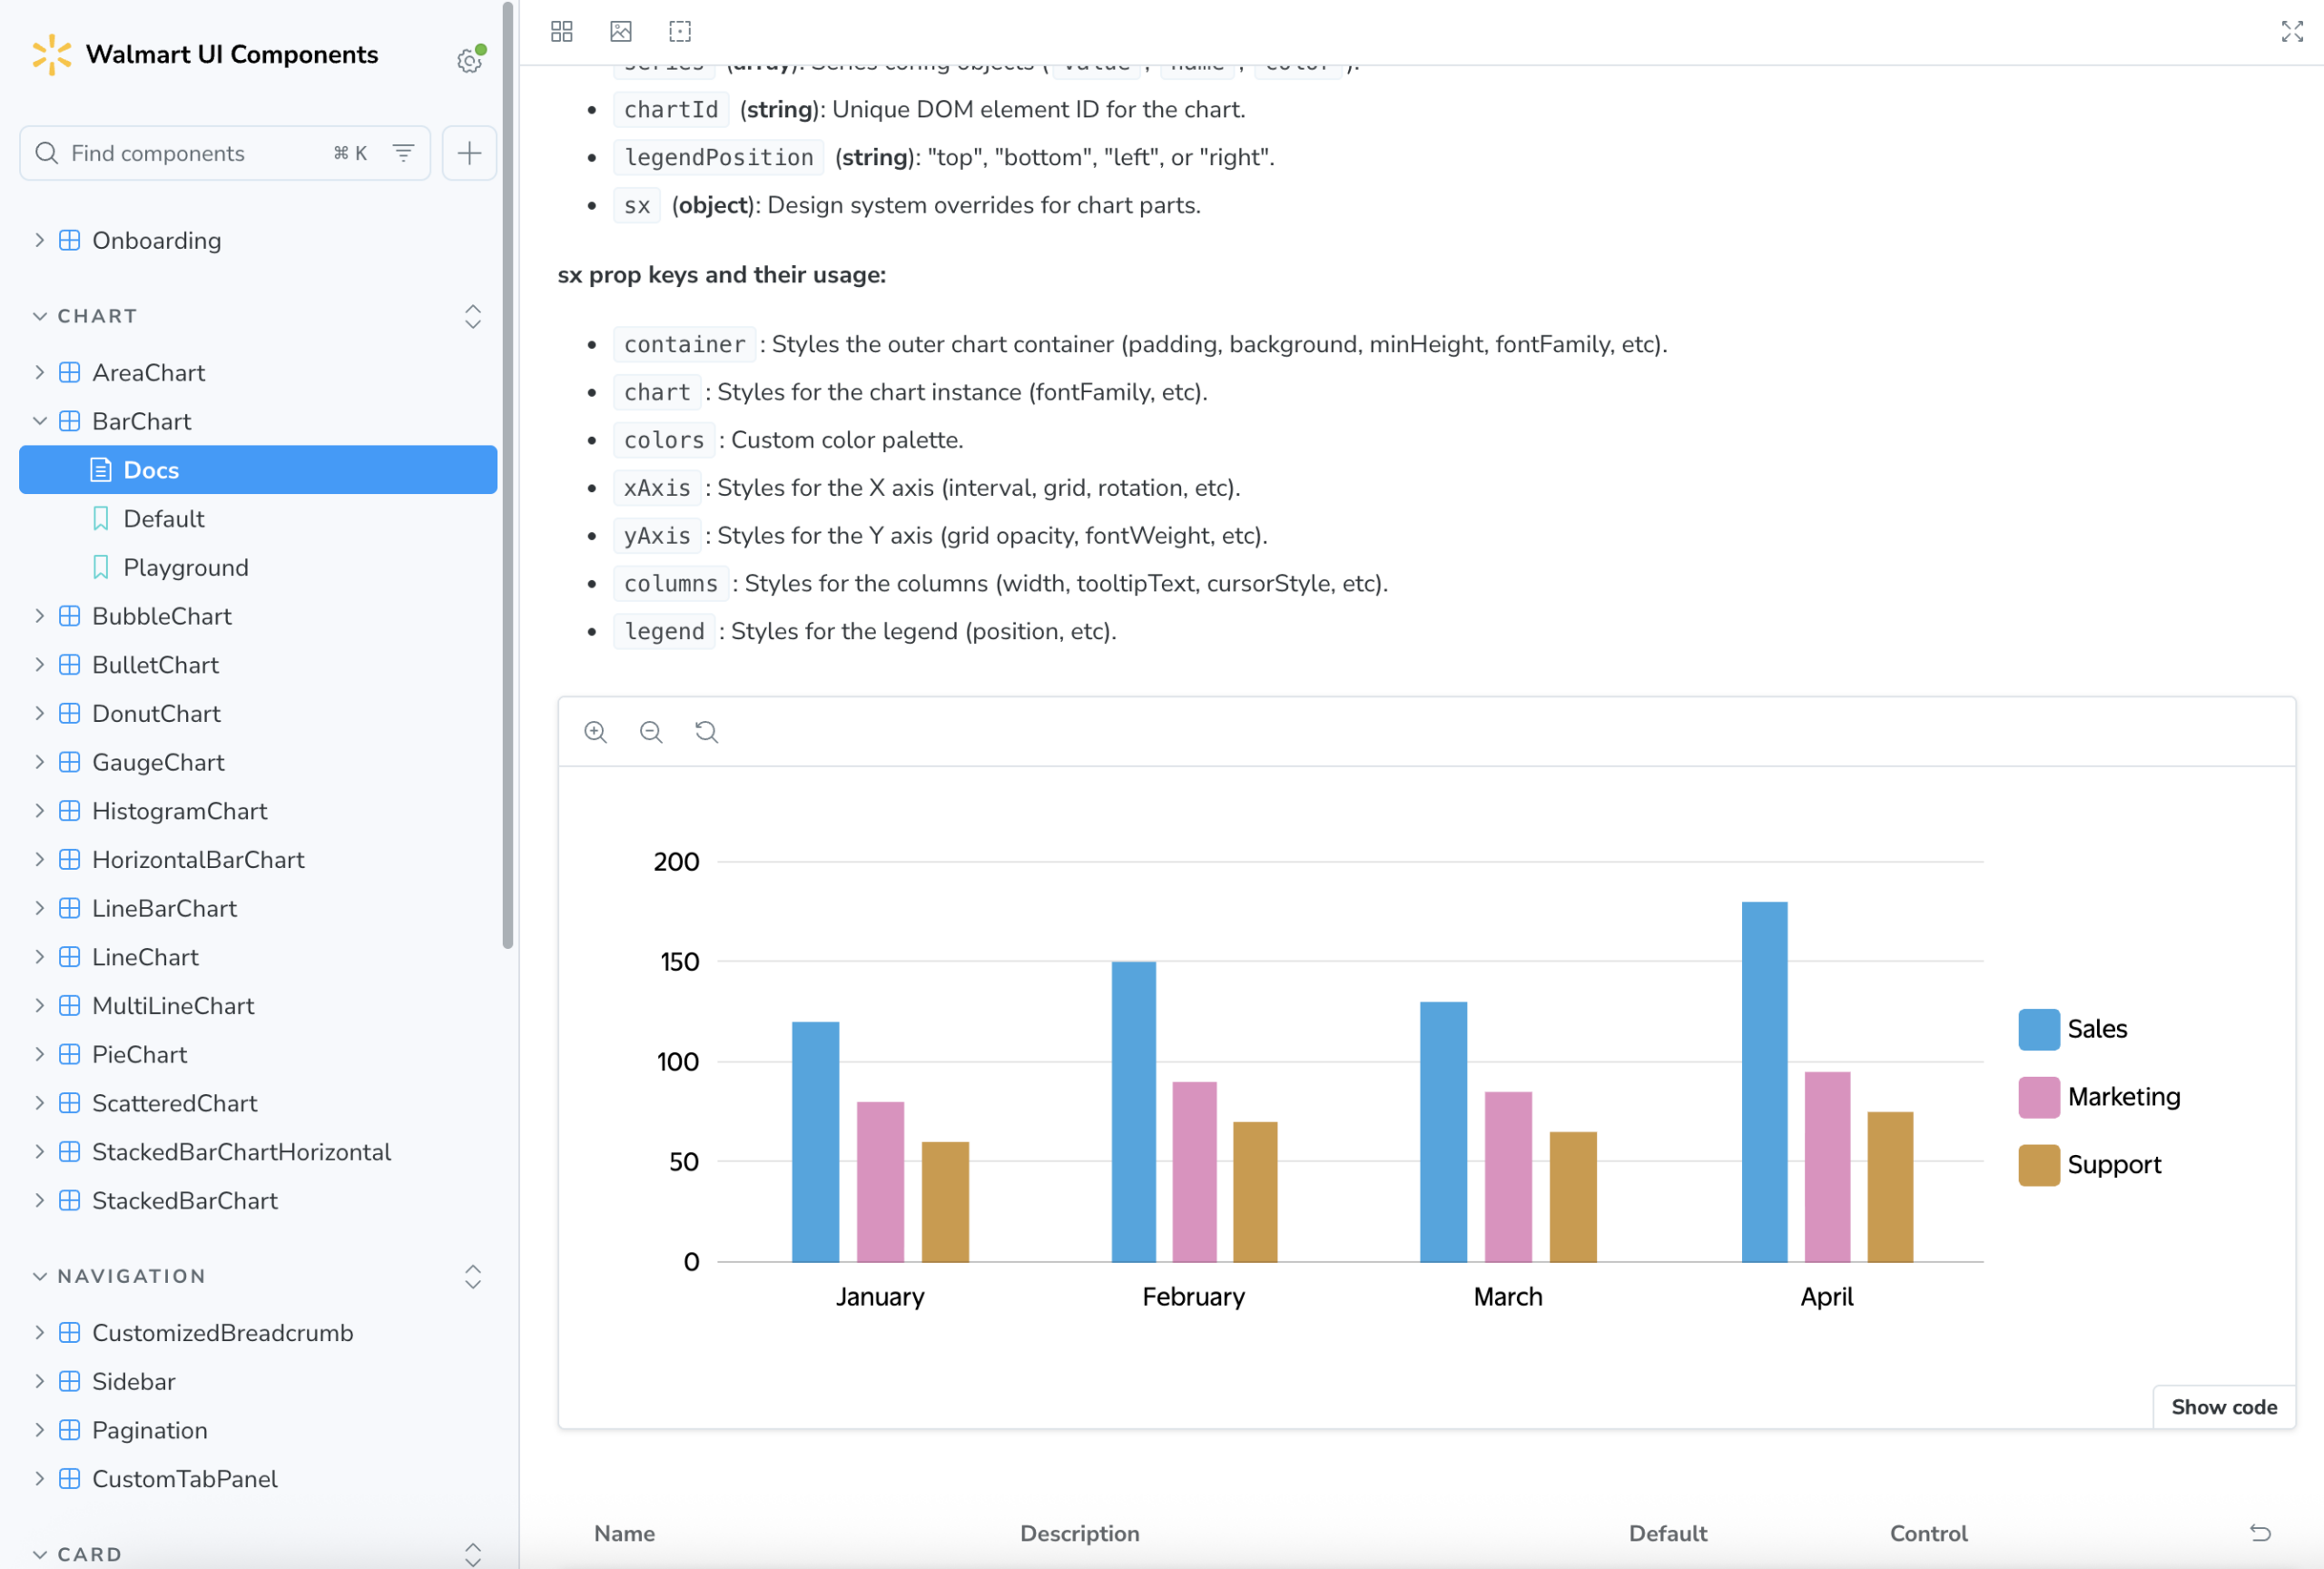
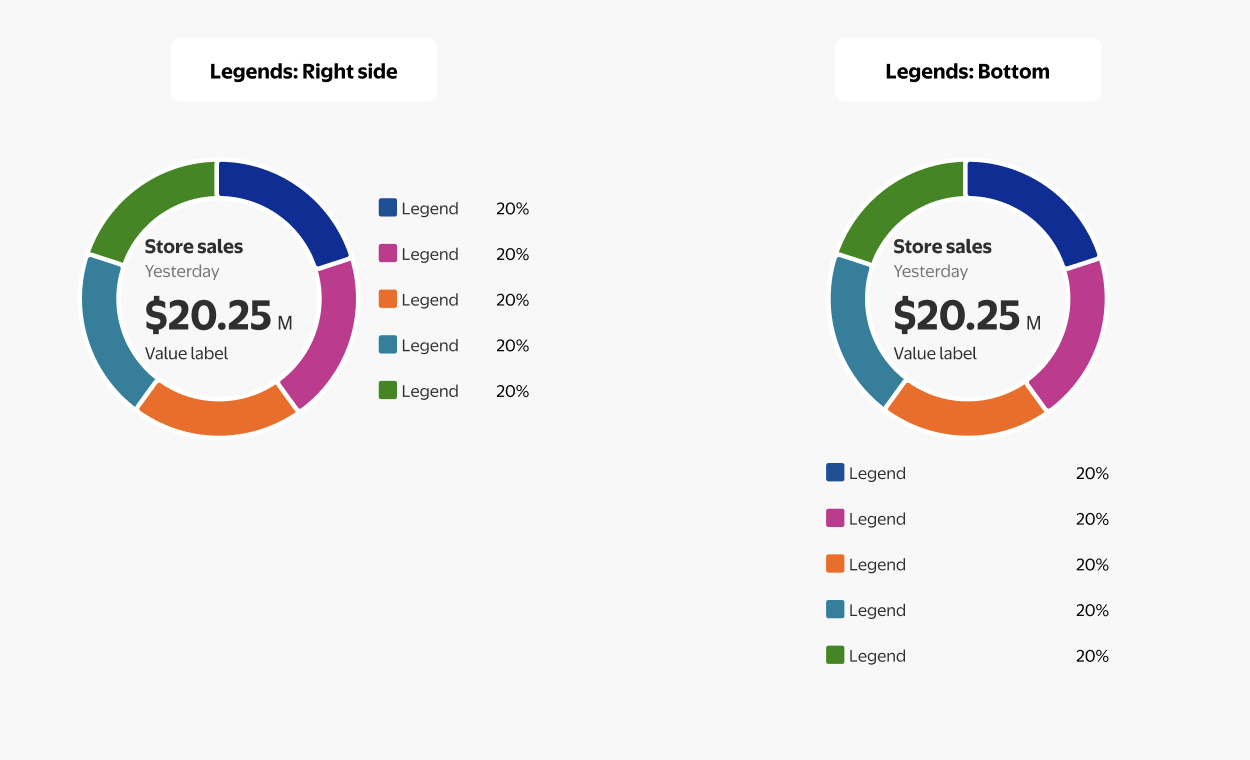
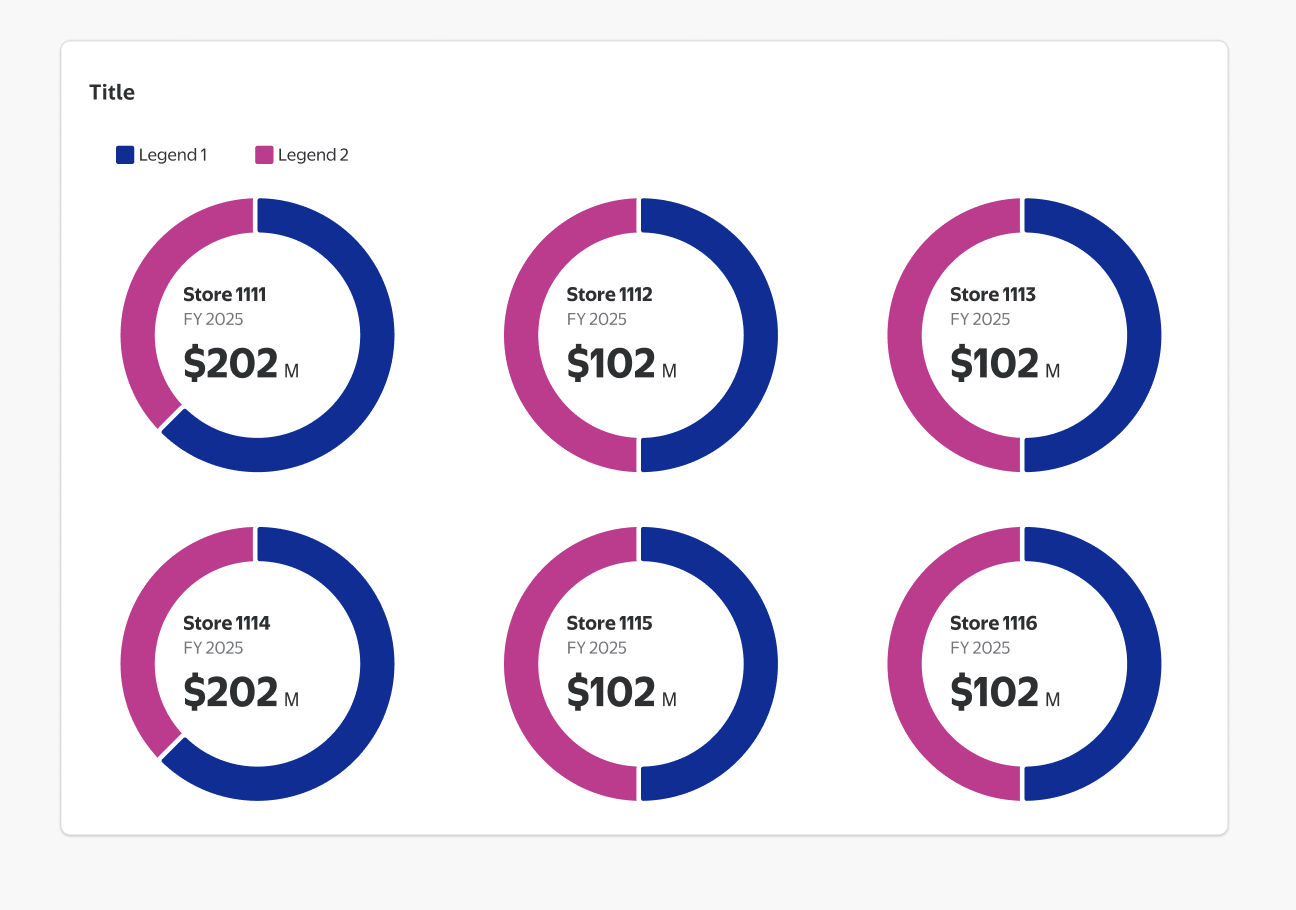
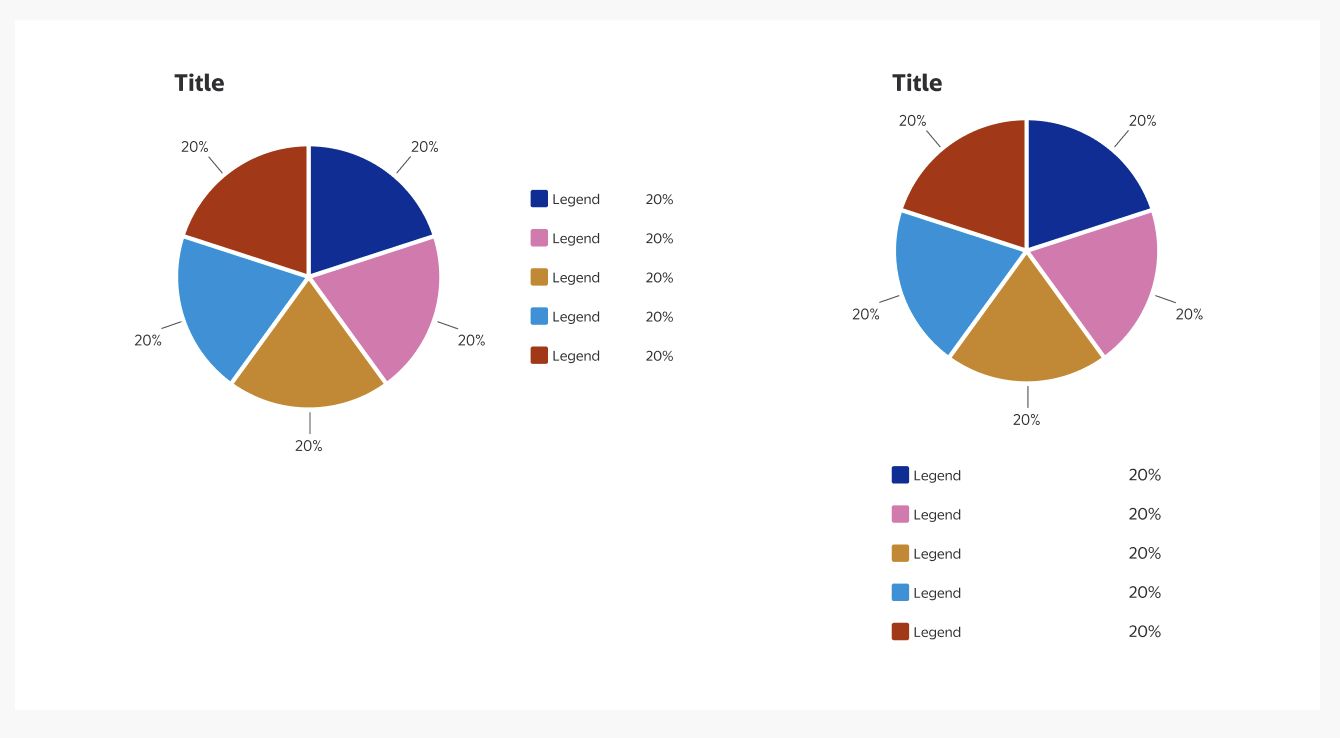
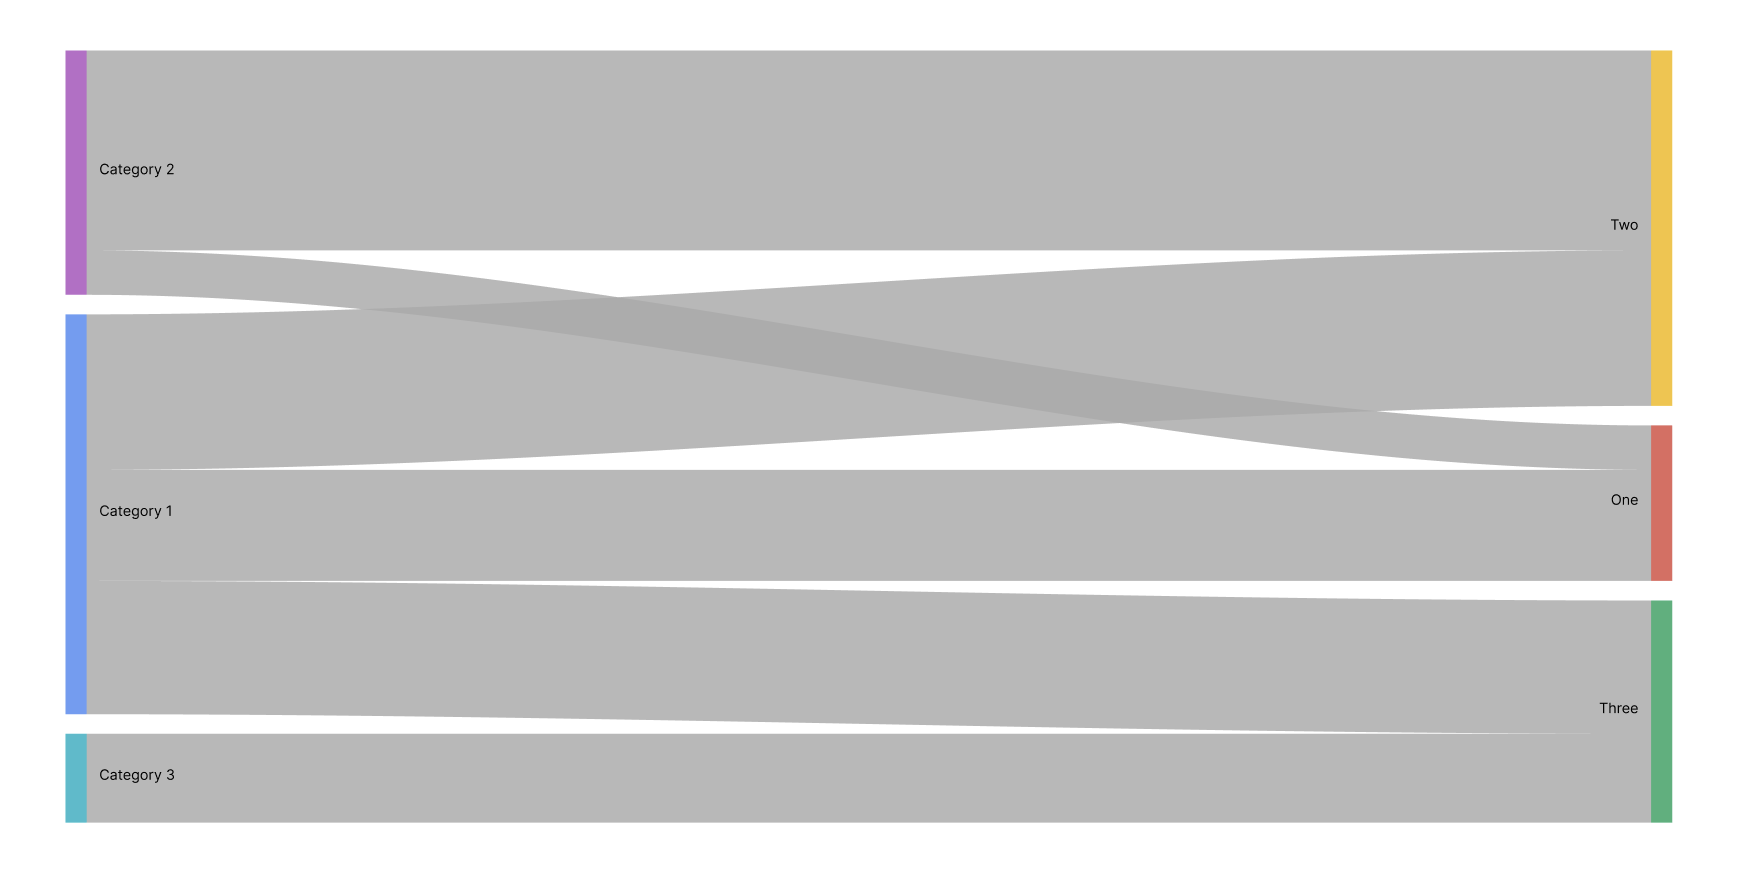
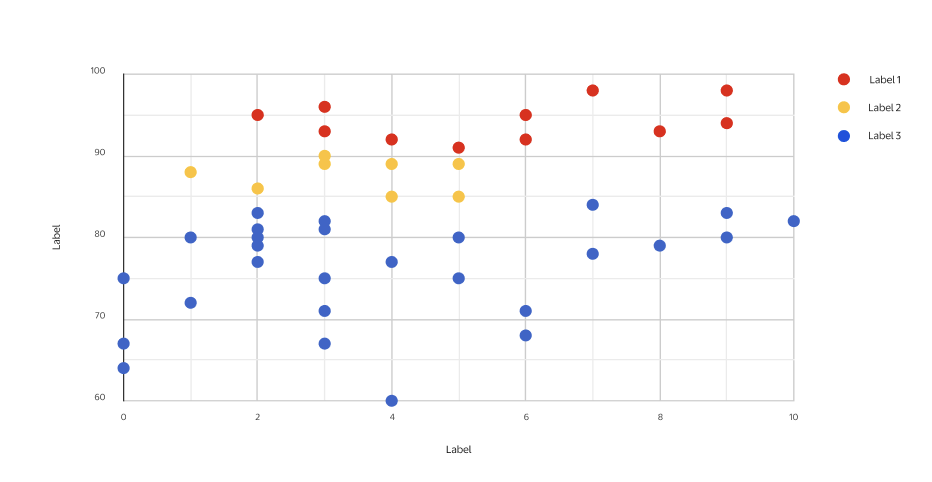
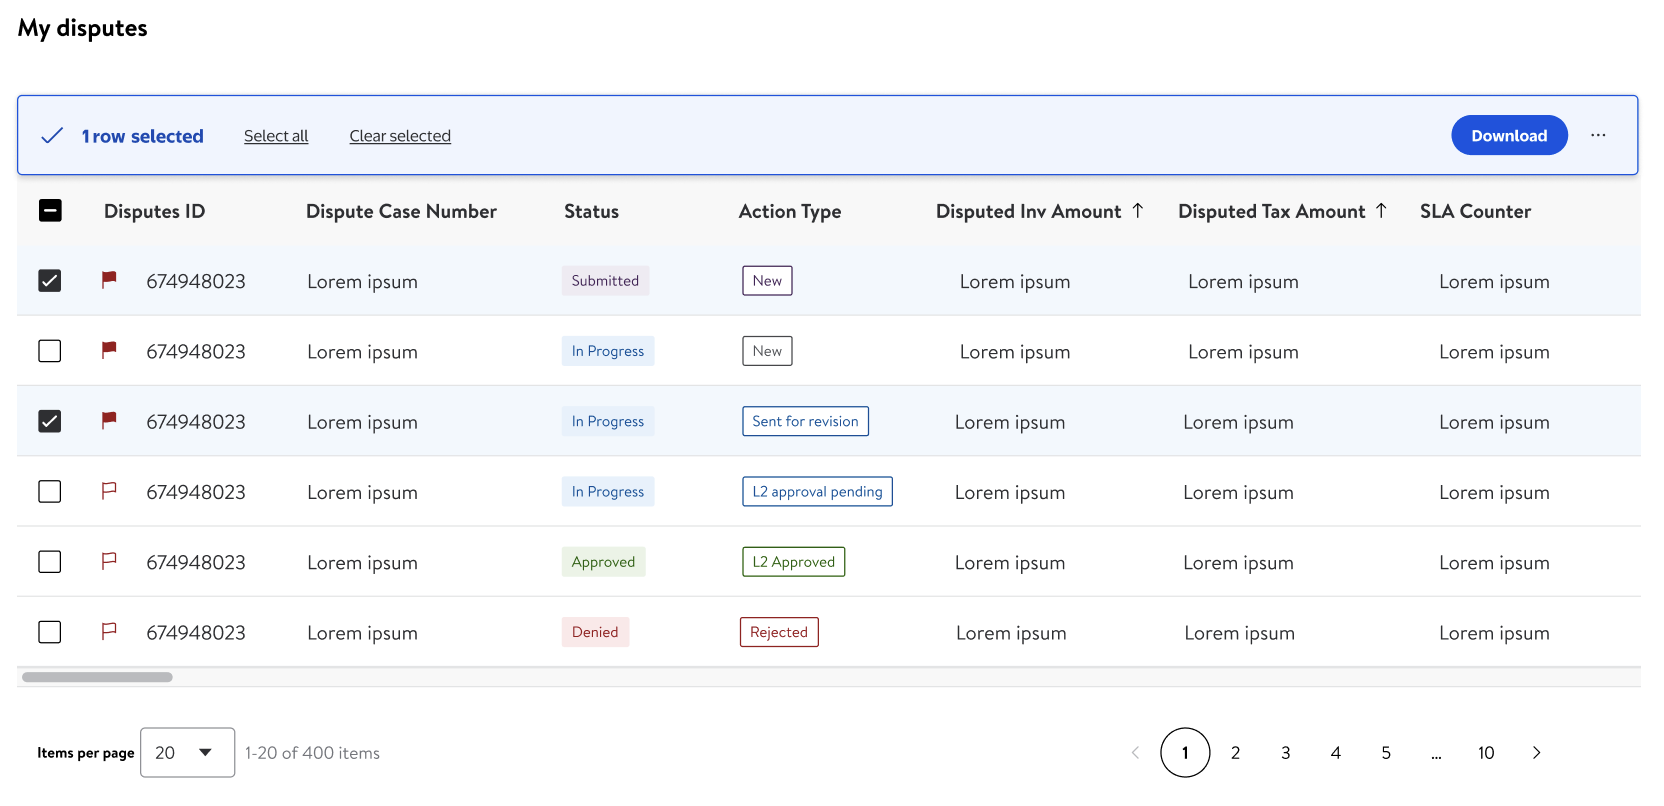
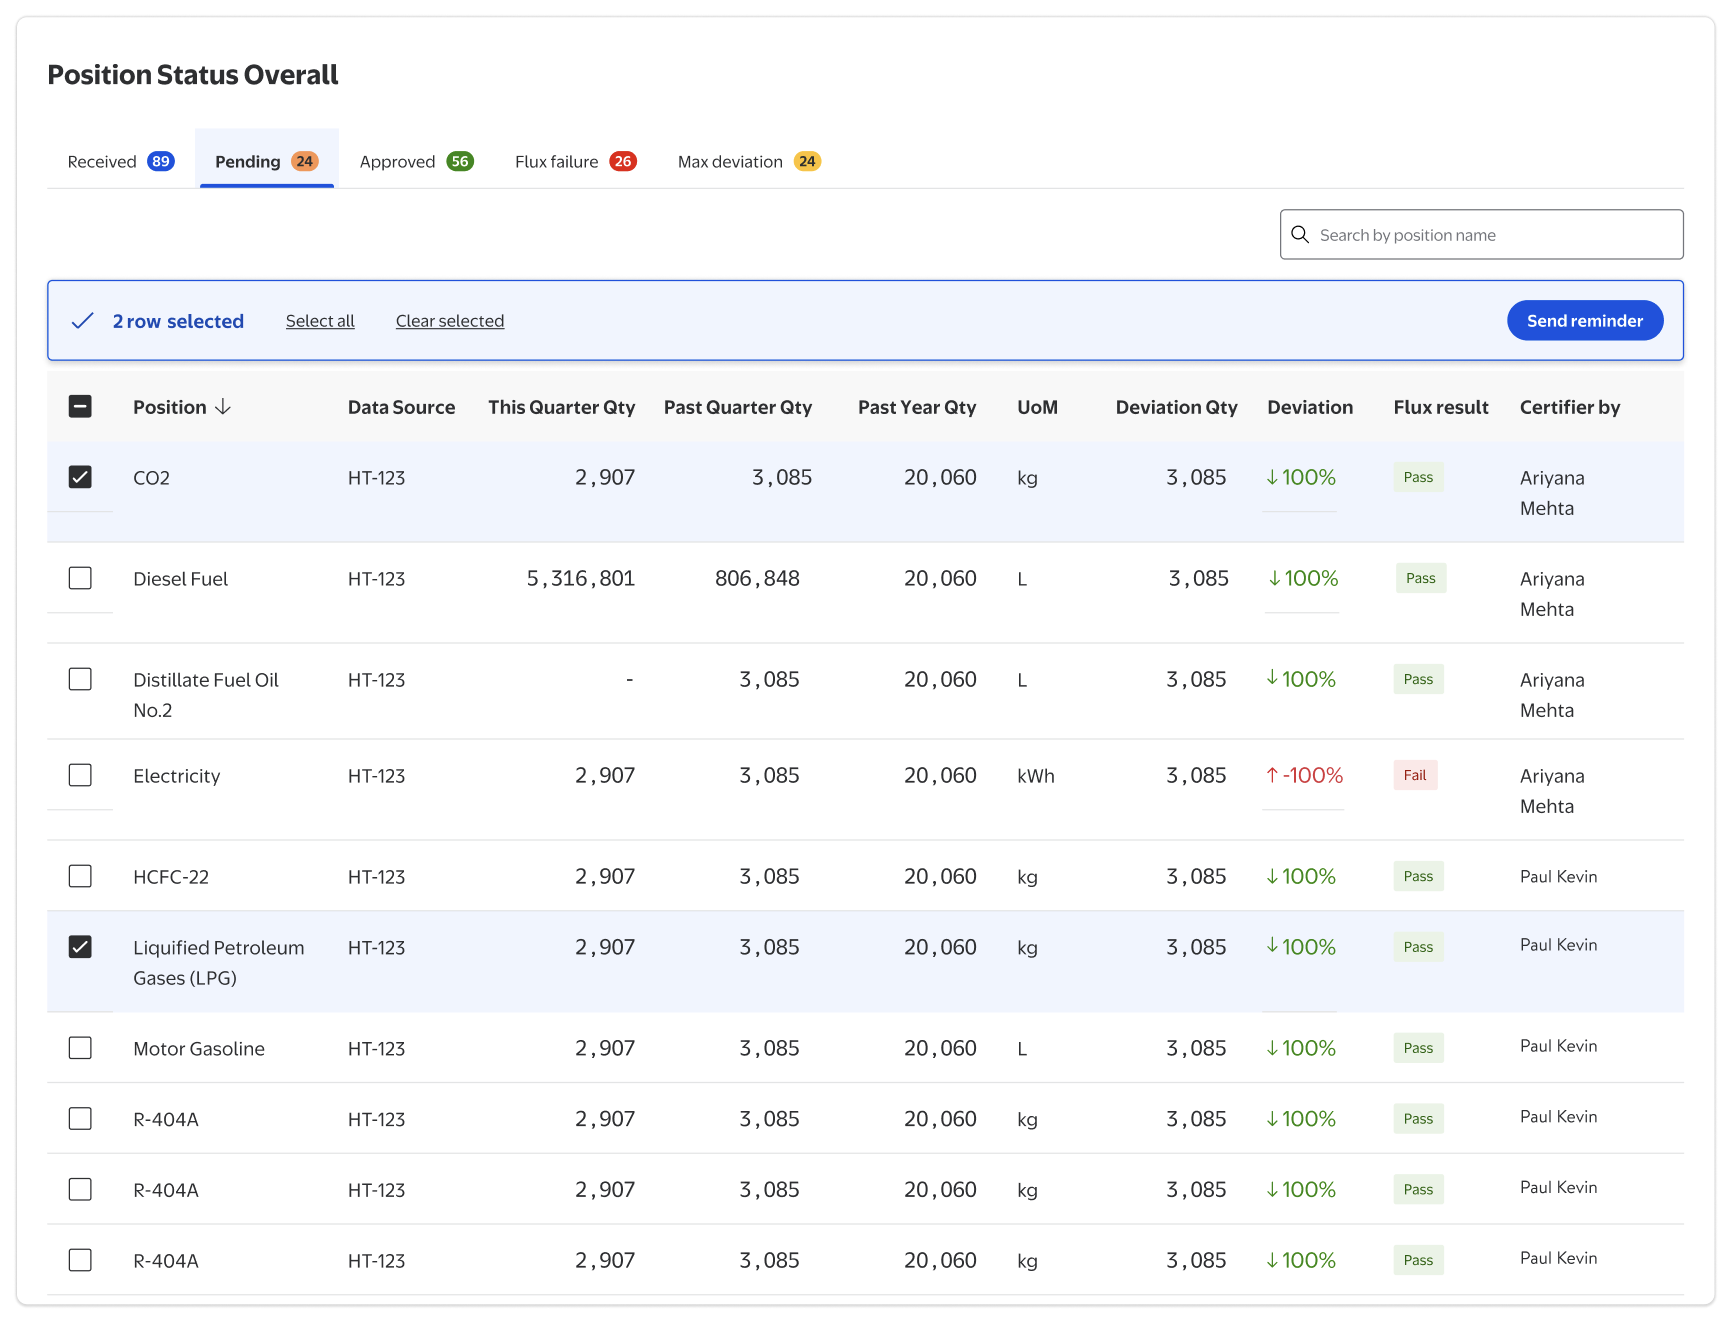
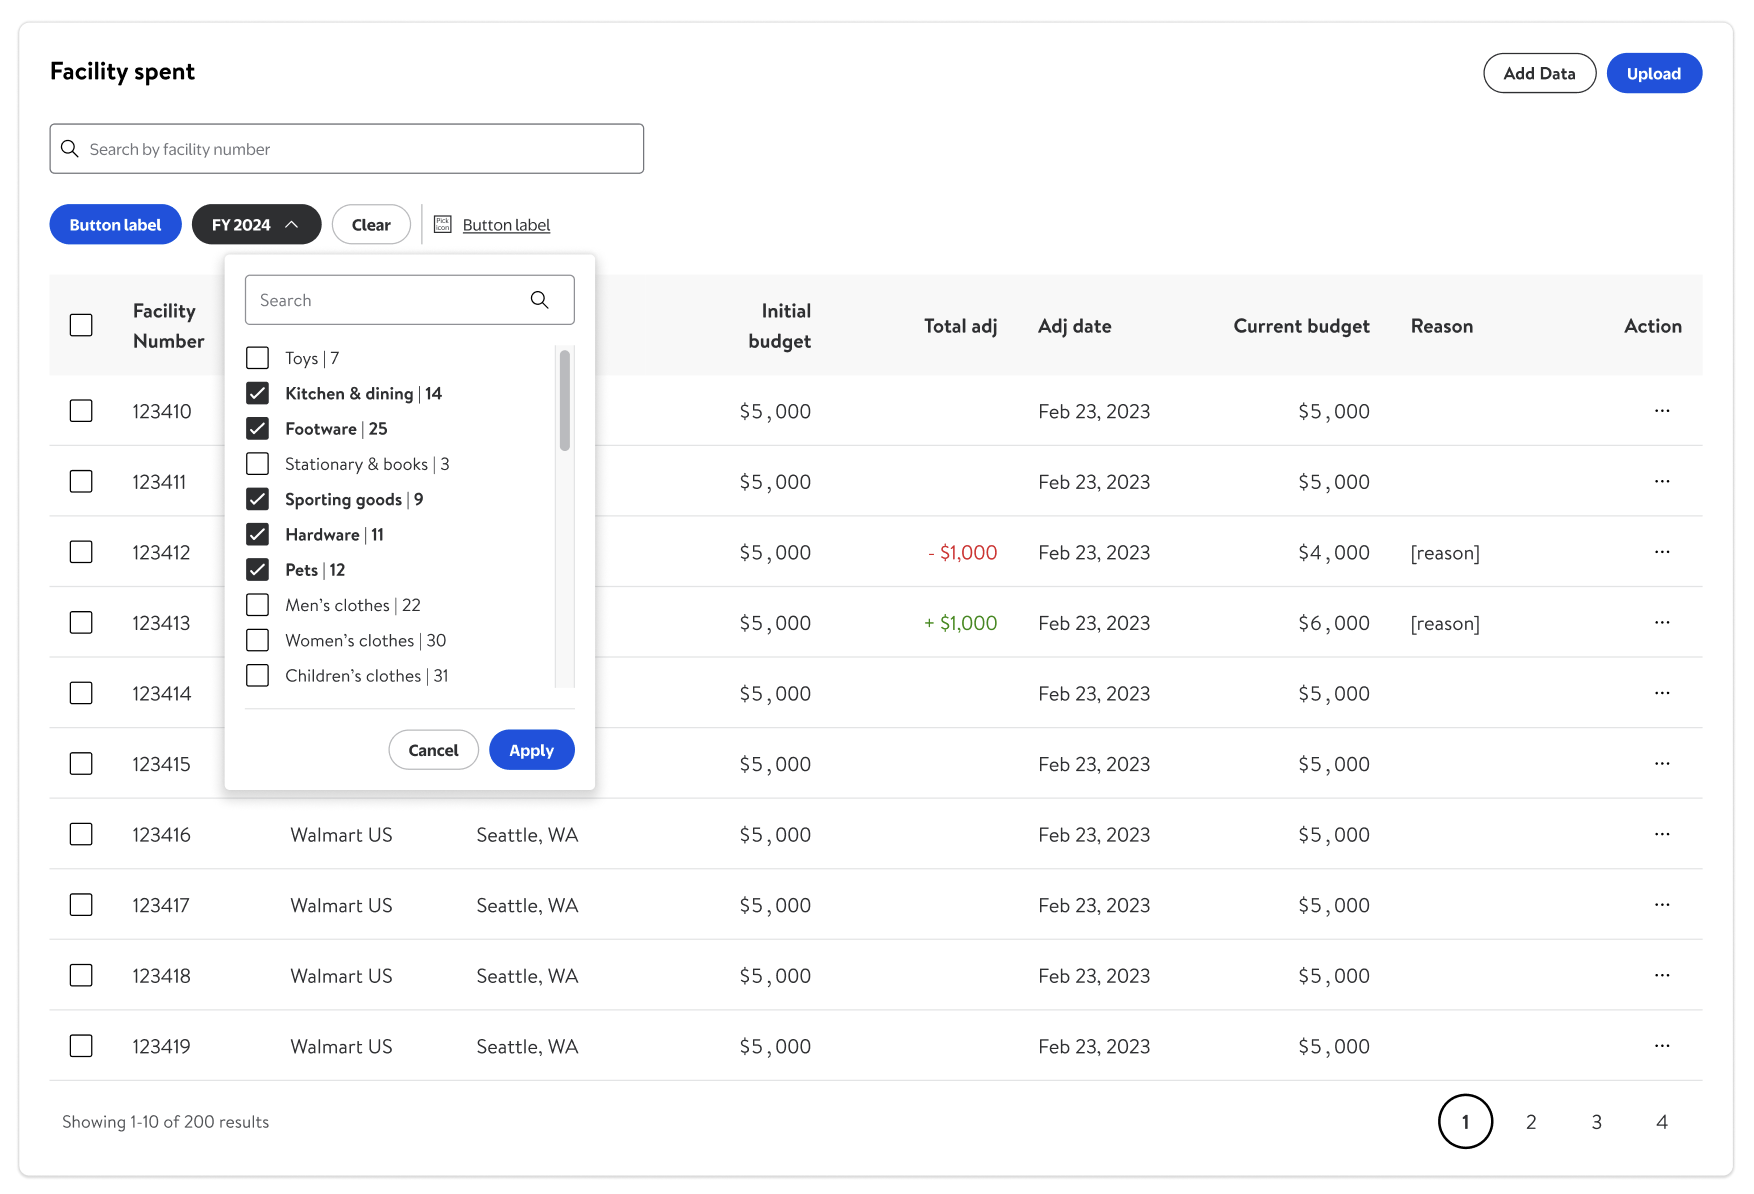
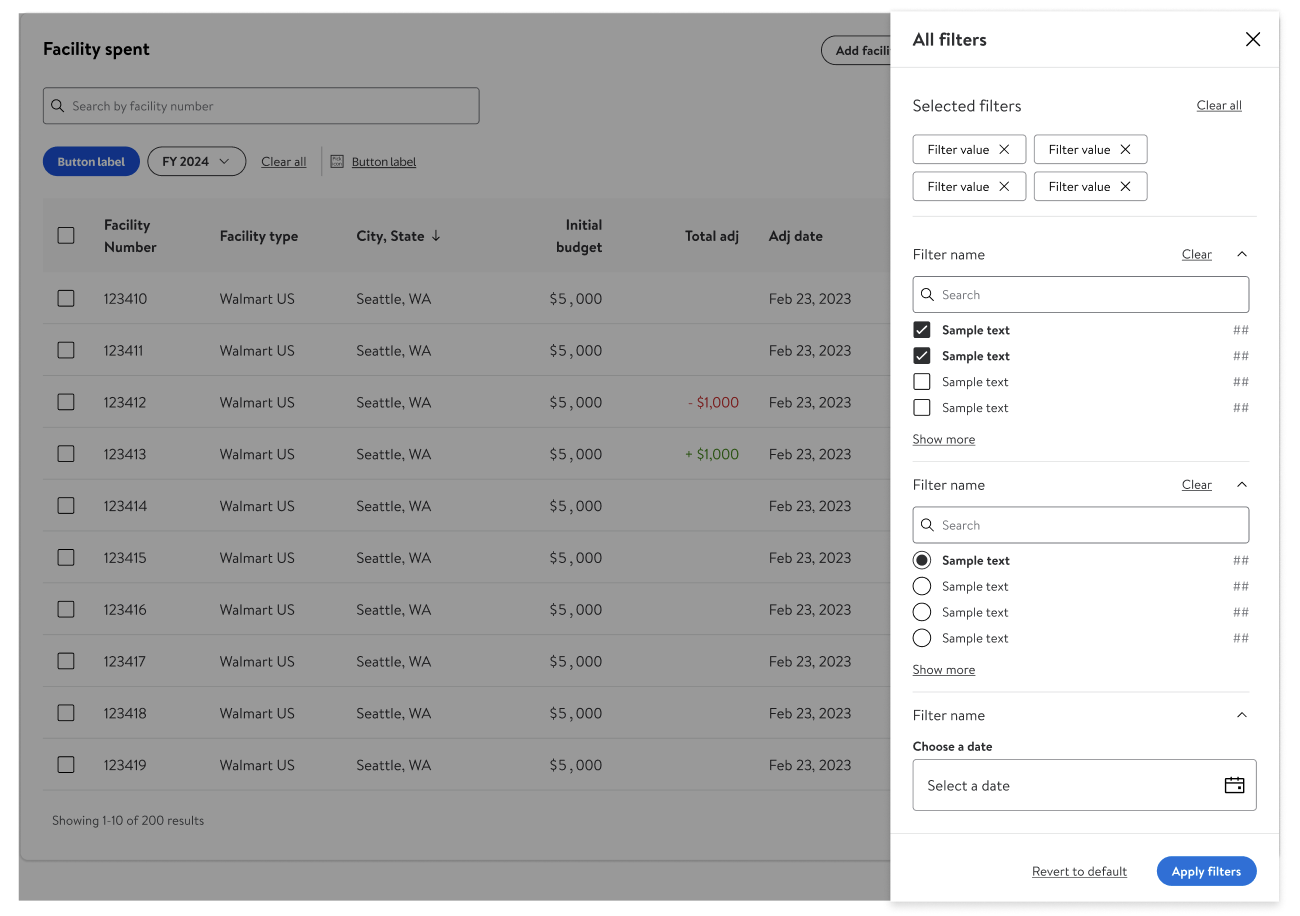
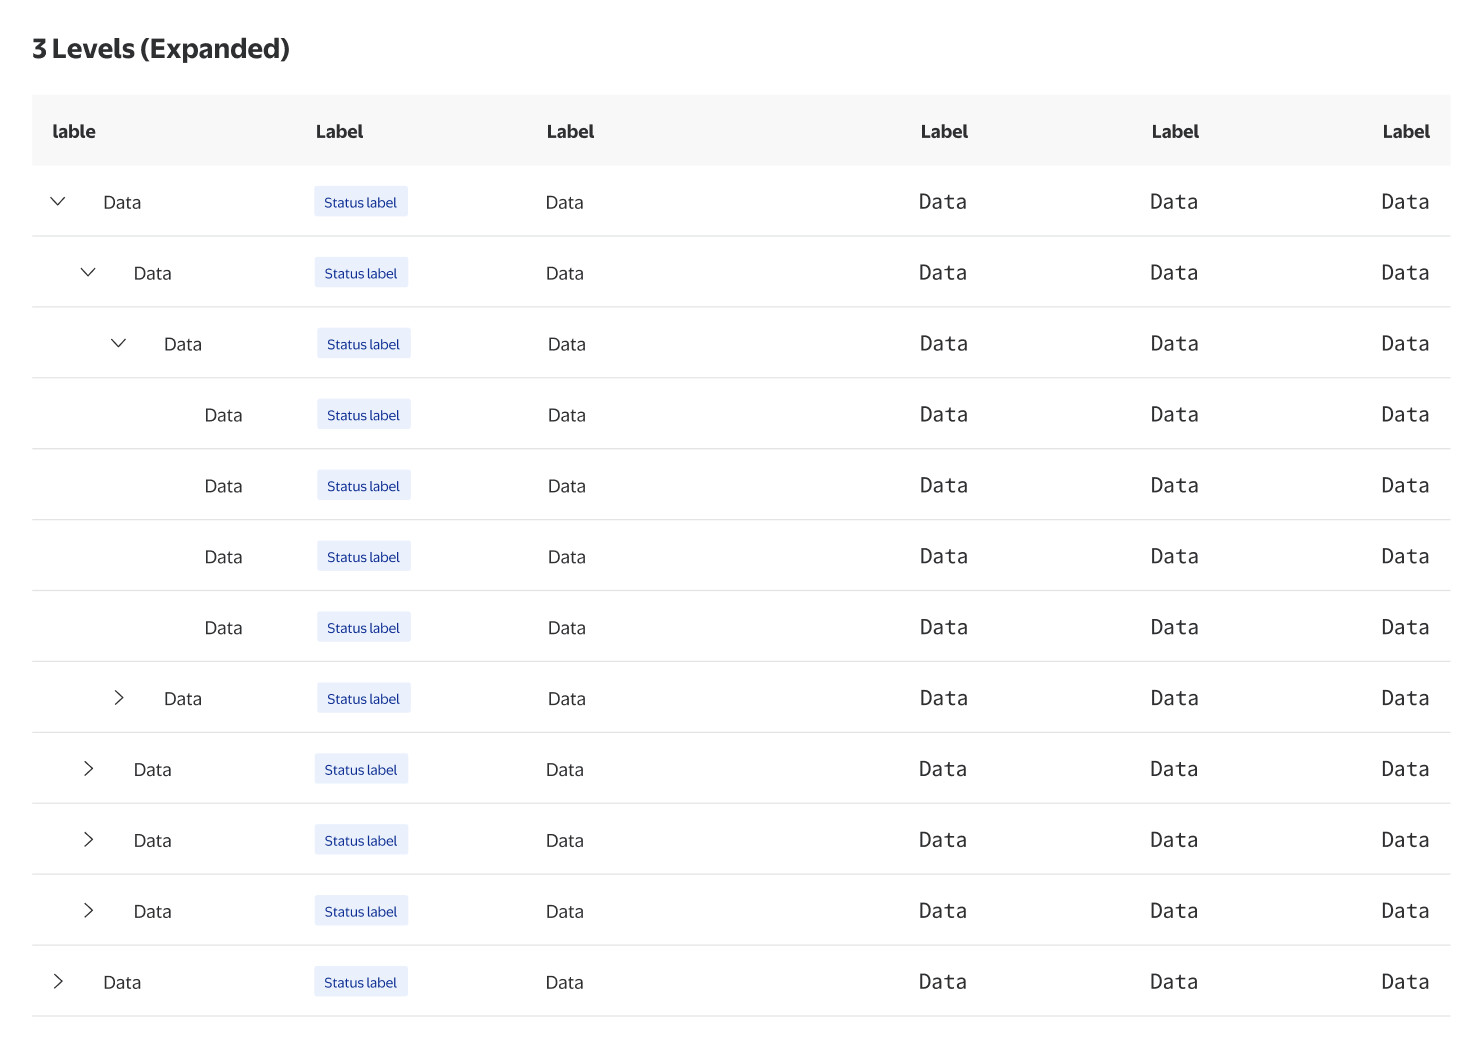
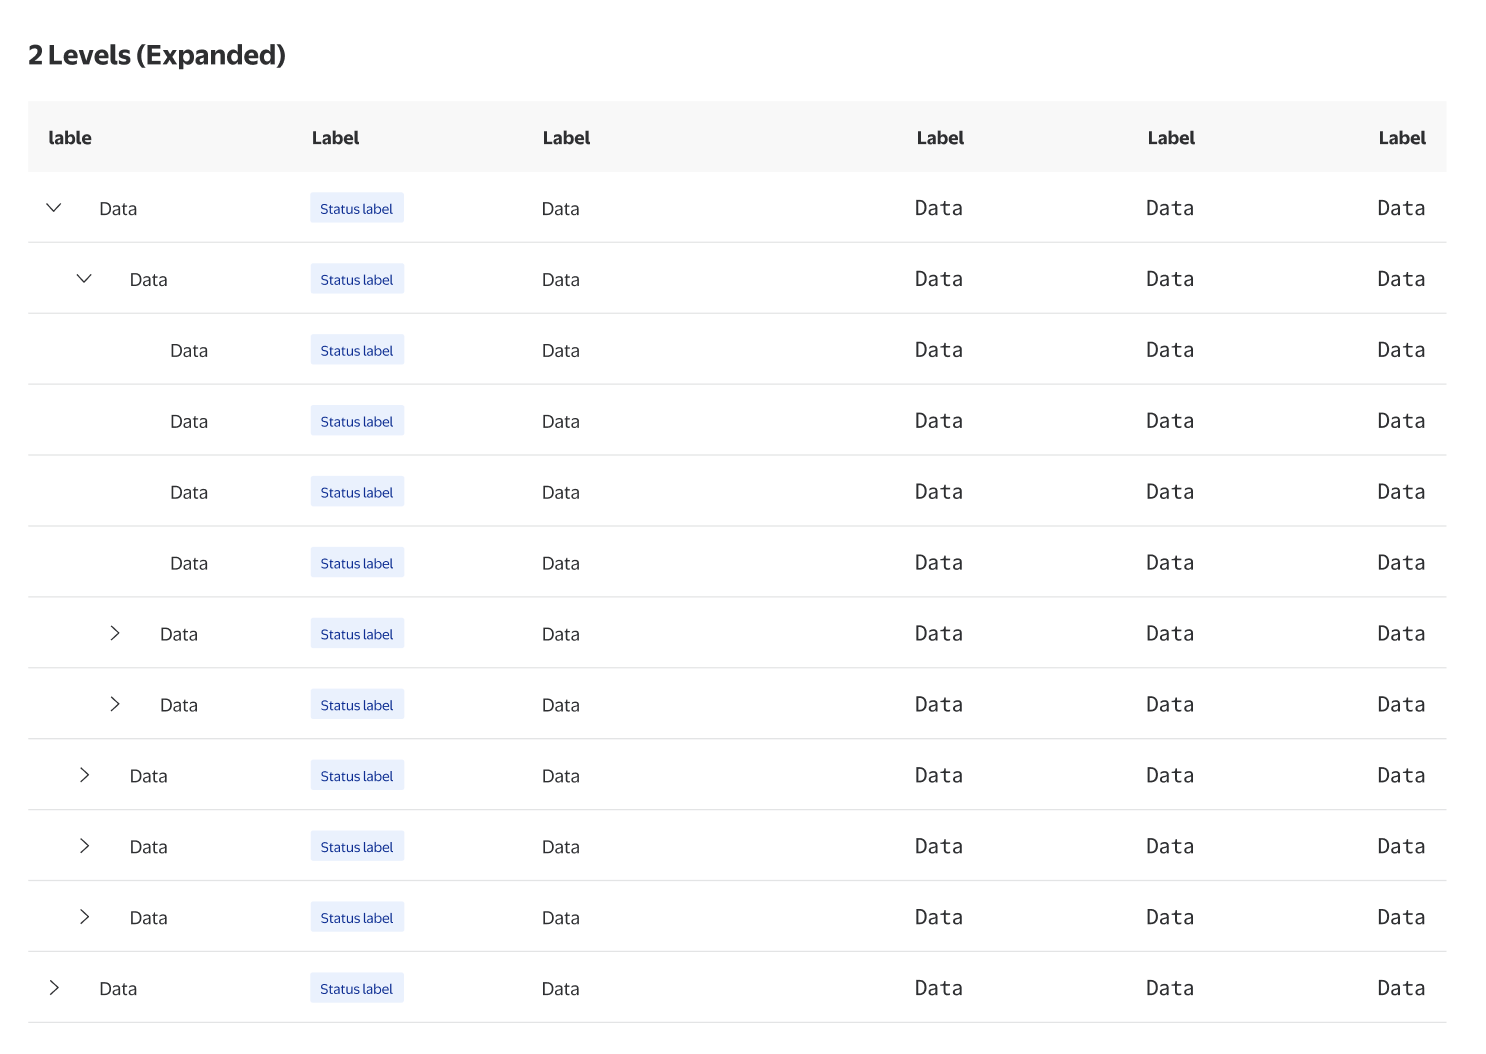
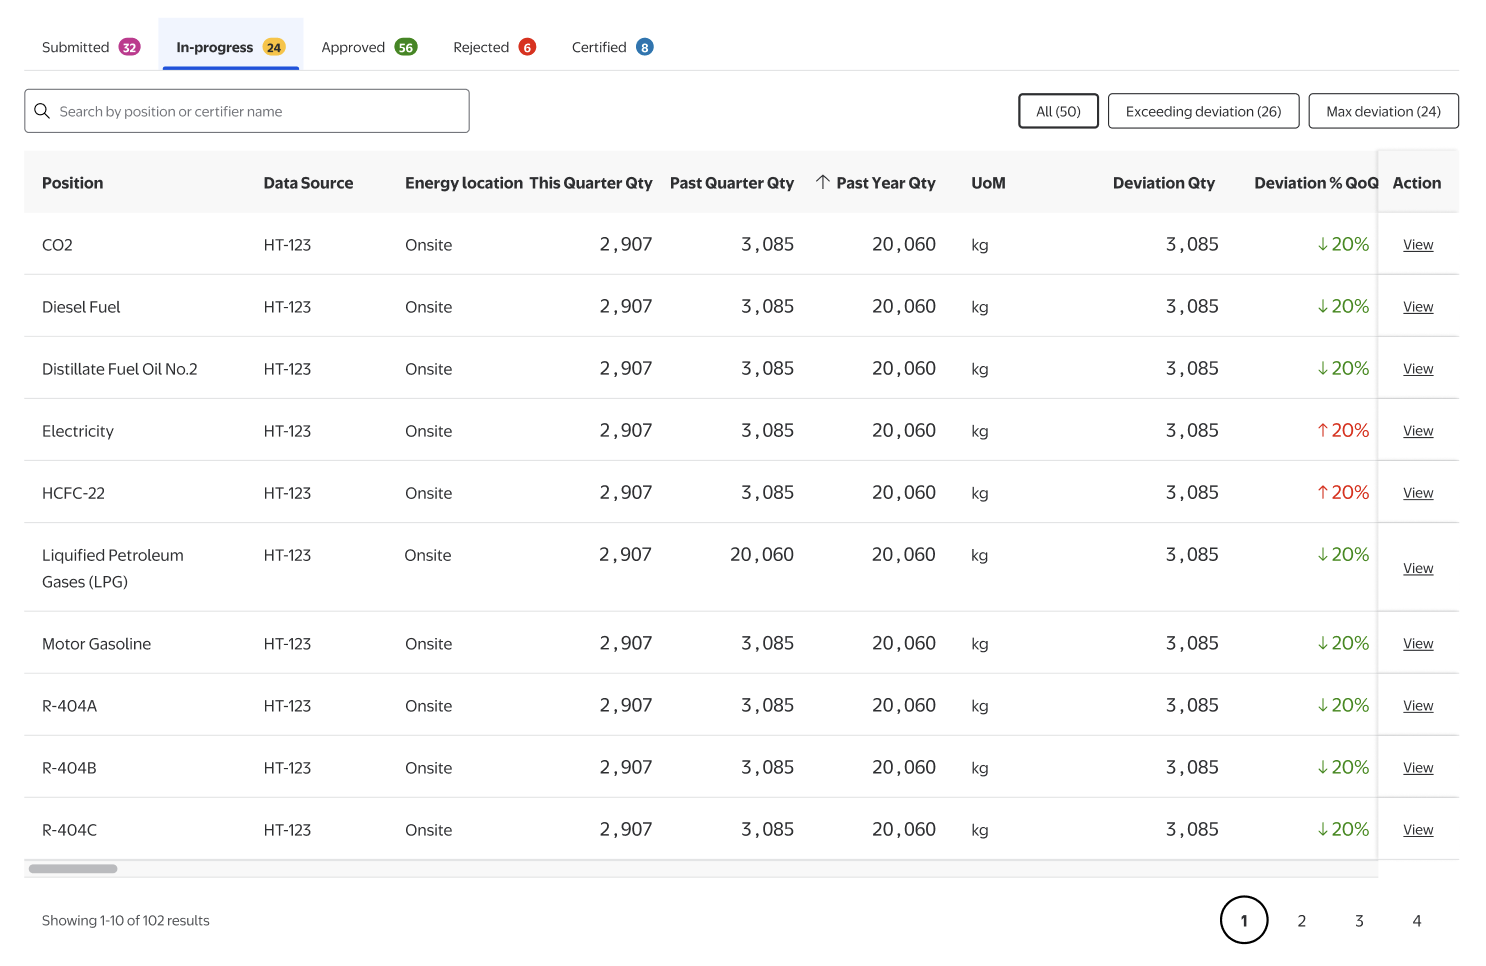
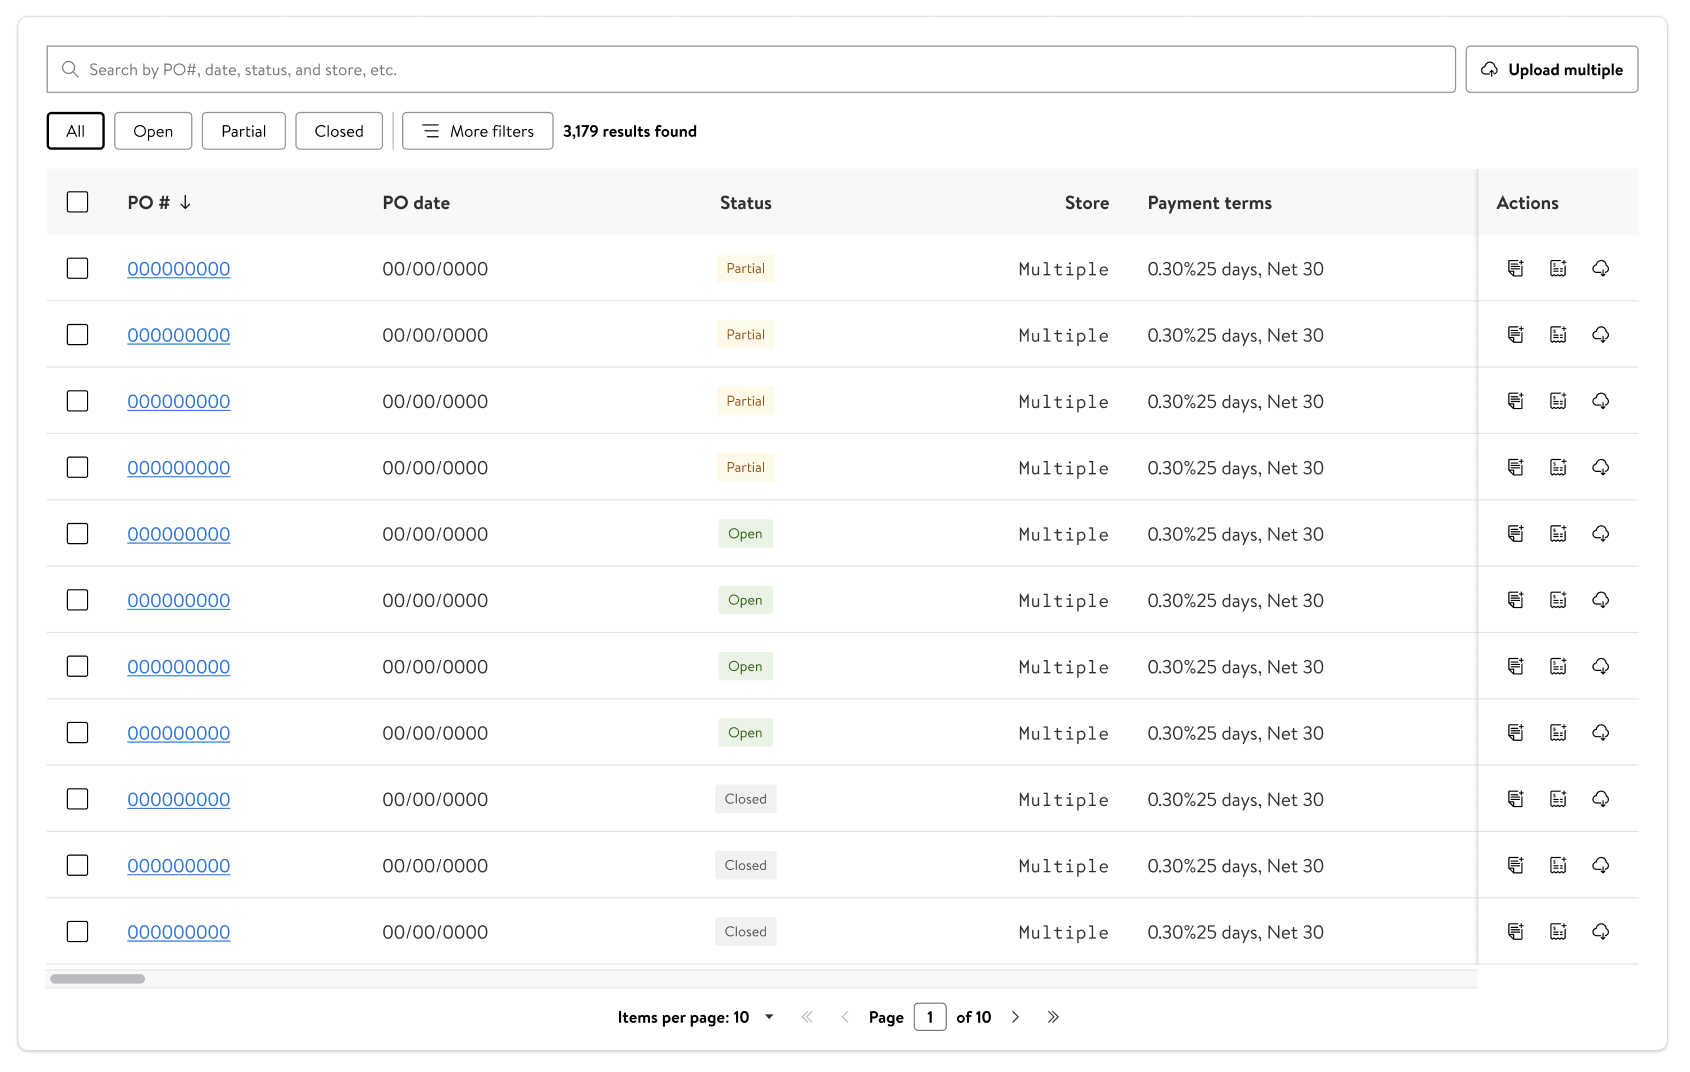
Component Architecture: Built a library of accessible, responsive charts (Line, Bar, Sankey, etc.) with strict adherence to WCAG 2.1 accessibility standards (color contrast, keyboard navigation).
-
Documentation: Created a comprehensive “Design Language” for data, providing guidance on when to use specific visualizations to tell the right story.
-
-
Impact: Standardized the visual language for data across the enterprise. Reduced front-end development time for new dashboards by 30% through the use of pre-built, themed components.
- A few screenshots from the Figma project and the “Storybook” UI component library.